


Maximize productivity and reduce costs with NI services. As your trusted partner and expert connector, we’re here to help you Engineer Ambitiously™.

Ensure Quality
Design with Change in Mind
Minimize Downtime
Reduce Overall Cost
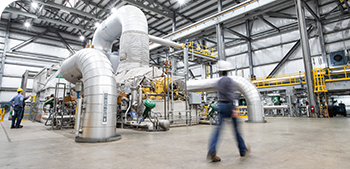
More connected equipment requires new approaches to software test. Deploying reliable, in-depth test strategies can promote synergy between complex hardware and software to keep equipment stable and long-lasting.
Customer Success
Being flexible and reliable doesn’t stop in the products we sell—it goes into our work as well. We will work together with you and our NI Partners to produce powerful strategies that push the boundaries of test.

We built a flexible and versatile system which could be reconfigured as new demands arose. The measurements we made were valuable. The amount of data and the rate it was acquired at helped us observe elusive phenomena.
Vestas Technology
NI Services
Maximize productivity and reduce costs with NI services. As your trusted partner and expert connector, we’re here to help you Engineer Ambitiously™.
An NI Partner is a business entity independent from NI and has no agency, partnership, or joint-venture relationship with NI.