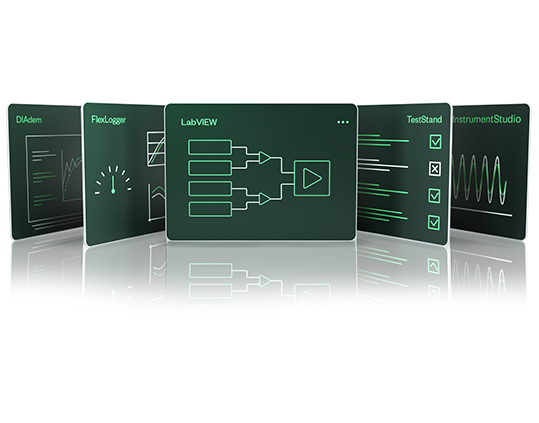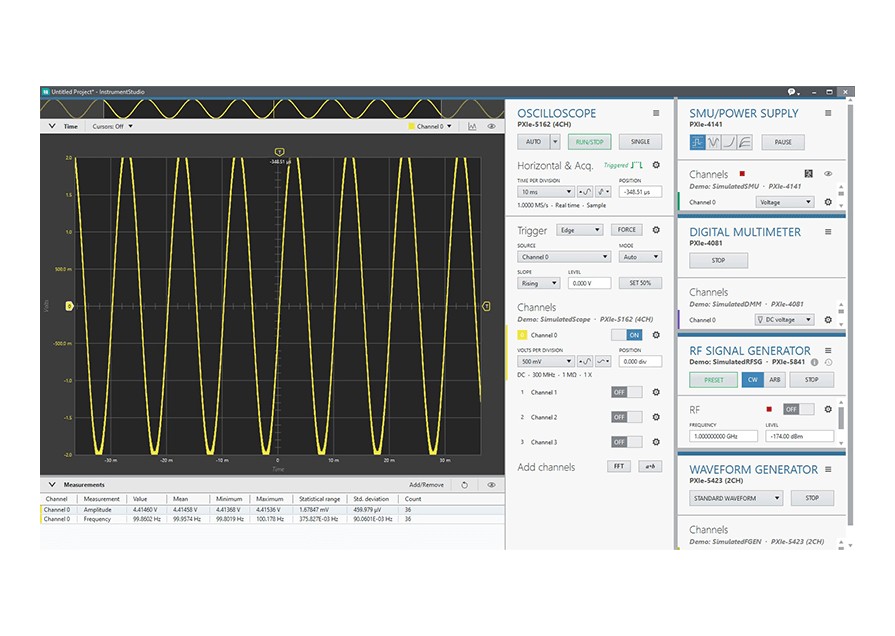
InstrumentStudio software provides an integrated environment for instrument configuration that simplifies quick, interactive measurements and augments automated production test systems.
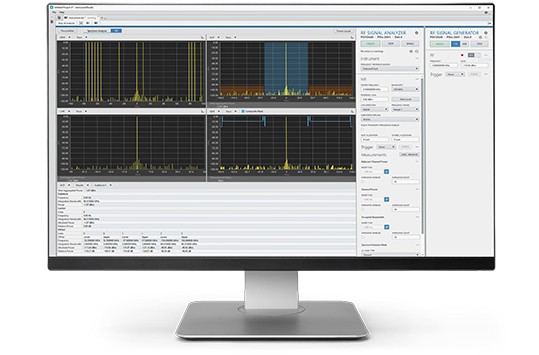
- Interact with multiple instruments simultaneously on intuitive, customizable front panels
- Monitor and debug automated test systems by taking control of API directly from InstrumentStudio
- Connect a wide range of DC, analog, digital, RF, and NI instruments
- Export instrument configurations to your choice of API
- Access RFmx Spectral Analysis and other wireless standards like 5G, WLAN, and Bluetooth