Test Asset and Facility Health: Opportunity or Cost
Overview
Being physically healthy enables you to have better overall quality of life. You can be more productive: not only is each activity more efficient, but you’re also less likely to pass the tipping point when you are forced to stop, rest, and recover. Finding time to go to the doctor for a checkup is hard; what is harder is actively monitoring yourself and noticing/accepting when something is amiss.
This same logic is true for your test assets. In fact, unplanned downtime costs manufacturers $50 billion a year—but the type of event that causes the downtime can have an impact beyond the immediate cost.
Implementing a good health strategy for your test assets is the only way to maintain the control of your facility and keep your equipment active and running.
Just as with your personal health, preventive care is much cheaper than restorative or even emergency procedures. Replacing the entire asset, buying a new one, losing the ability to produce or test, or bringing assets to a stop are only few examples of possible failures that mean cost and negative impact for your brand and business.
Industrial production has evolved enormously over the last centuries, and machines are completely interconnected along the production lines. This means that a failure of a single part can cause damage to the entire system and create a bottleneck for the whole facility. Proactively monitoring your test asset health is the most efficient way to take control on your equipment and increase uptime.
This white paper guides you on how to manage the current challenges to keep all your assets up and running, accelerating the product development process, and meeting the company’s vision with the right strategy.
Investing in the health of your facility is an opportunity and not a cost. Are you and your company ready?
Contents
- A Clear Strategy for Asset Management
- What is Your Strategy? Is It an Event-Driven or Data-Driven Approach?
- Where to Start
- What to Do Next
- Next Steps
A Clear Strategy for Asset Management
These days, it is fundamental to have a clear strategy to be successful and remain competitive
Being fast and well-timed is the basis for bringing new features and new products to market—and a clear path with tangible projects and initiatives is the key driver.
For example, many manufacturers use big spreadsheets to manage equipment maintenance. This means logging when events happen into the spreadsheet, creating an inventory of spares, and using the information of when different parts failed to create a history. This empiric approach ensures the replacement of the part failed before it breaks next time, but doesn’t consider the high cost in:
- Technology, because you can replace perfectly healthy parts before they fail just because the historical data suggested doing so
- Resources, because creating a rich inventory of spares requires a full-time job, completely dedicated to managing it continually
- Downtime, because the time to fix the issue or order damaged parts is expensive
An established planned maintenance tactic is the first starting point, but to create a clear strategy is fundamental to know the reason behind a failure.
In this context, the quote “knowledge is power; power provides information” can be interpreted to mean that when we really know the causes that generate phenomena, we can intervene just in time—and turn a situation to our favor
However, just because we have the data somewhere doesn’t mean we have the processes in place to use it. How much data do you and your company generate every day? Your company might generate billions or trillions of pieces of data. Do you have time to investigate and extract insights from it? Studies have shown that organizations fail to use an overwhelming majority of data they collect. A study by Gartner reports that approximately 97% of data sits unused by organizations. The need of the hour is that insights should be extracted from as much data as possible to drive great business results.
To compete effectively, companies must not only use all data to improve the product development process but also leverage test data to identify critical issues that affect quality and performance. Collecting data for a long time builds a good foundation—but correlating the causes and effects requires data insights. Part of the information comes directly from your assets, but it must be augmented with additional sensors. Sensors capture data that provides the information you need, including the reason behind the failure, how the ambient environment potentially played a role, or even how a transient in the power supplying the system impacted your equipment.
Thomas Redman said, “Where there is data smoke, there is business fire.” If you are not handling data correctly (the smoke), this is the cause for bigger problems across the organization (the fire). Therefore, investing in resources to collect, store, and use data correctly is the key to put out the fire.
What is Your Strategy? Is It an Event-Driven or Data-Driven Approach?
Event-driven strategy uses reactive management. Conversely, a data-driven approach helps companies to act proactively. Figure 1 depicts the journey described by the maintenance maturity model:
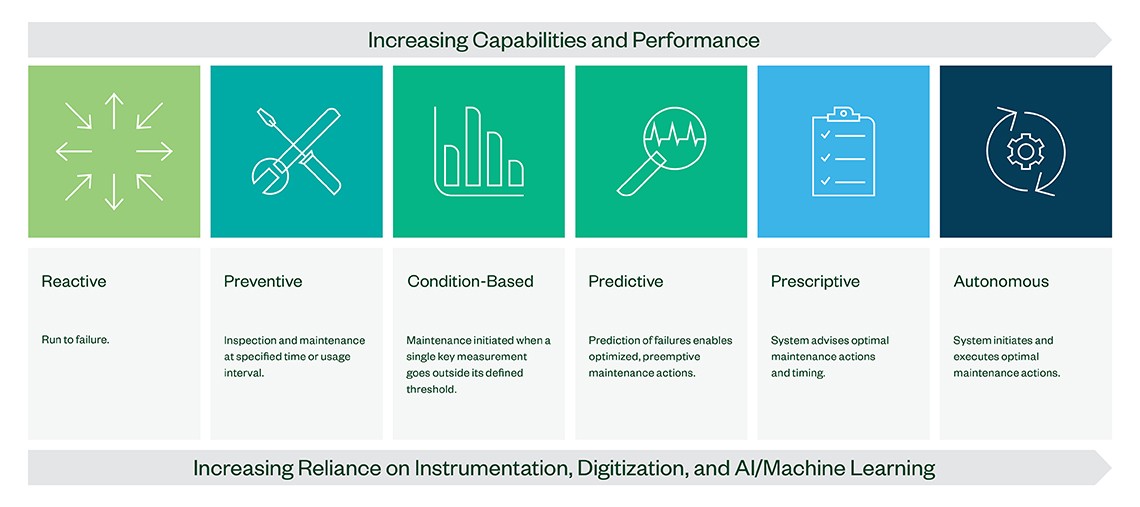
Figure 1: Maintenance Maturity Model
- The first level is where assets typically run to failure, implementing a maintenance strategy in reaction: fixing when they are broken.
- The second step is a time-based approach when engineers pre-schedule a plan to take regular maintenance actions.
- The next level starts optimizing assets, increasing capabilities, performance, and reliance of instrumentation and digitalization.
Conditioned-based monitoring on your test asset enables real-time insights into the operational performance. As you move to predictive maintenance, you can expect to witness more than 90 percent overall equipment effectiveness (OEE) and uptime. This approach allows you to implement user-defined rules to initiate maintenance activities, then monitor the conditions that trigger events and actions. For example, an alarm or notification alerts when a critical part approaches the final year of its remaining useful life. This is fundamental to ensure a spare part is on hand when needed; when your company can reduce the carried inventory, that helps control costs.
The highest level of this model is autonomous maintenance that takes this analysis a notch higher—it not only predicts failure events, but also recommends actions to take and executes for you. The first step to embark on this journey is determining where your company falls in this model, and where you want to be moving forward.
Where to Start
The first thing to do is look at which assets are critical to your business—those that will have a substantial impact if they go down unplanned. Data can help determine failure points, because it also can consider causes like environmental factors that can accelerate how fast a part degrades. This is even more important if your company uses the same equipment across different continents. The baseline climate can be different across regions; influences like temperature and humidity can play a vital role in a failure.
When you know what you need to monitor, you can augment existing equipment with smart sensors that collect data at the edge. These sensors do the first level of data processing in real time, helping you move to an automated approach for maturity model in Figure 1.
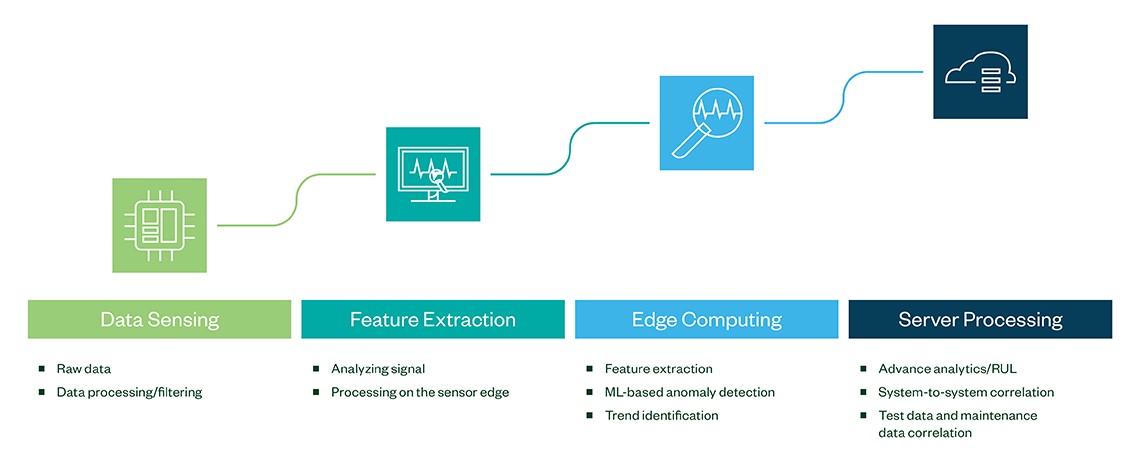
Figure 2: Data Processing Maturity Levels
The principle is straightforward: If you can’t get the data closer to the data center, get the data center closer to the data. Collecting data at the edge ensures that information is processed at the periphery of the network, close to the originating source. Rather than transmitting raw data to a system controller for processing and analysis, that work is instead performed where the data is generated. This first level of feature extraction at the edge allows for pre-processing data in real time with a consistent reduction of latency in the system.
The next level is connecting these smart sensors to a system controller for deep edge computing. Doing so delivers high-quality data; collection and feature extraction is accelerated by using machine learning (ML) on the edge for anomaly detection and trend identification before data is sent to the server.
At this level, you can do further analysis and implement features like notifications and alarms, automated condition-based recommendations for troubleshooting and automated reporting. You can also deliver data and visuals in dashboards, which are helpful for remotely monitoring your equipment, checking where anomalies are, and determining the remaining useful life (RUL) of your test system and components. Infrastructure at this level enables you to focus on the data you need and gives you better control of plant and dispatch maintenance teams in a targeted way.
What to Do Next
A proactive asset optimization is not an easy task to start, but it is well worth the effort—and you don’t have to do it alone. NI is recognized as an expert that can support you in this challenge, from collecting to storing and analyzing test data and converting it into a powerful tool that adds value back to your organization—across the entire product lifecycle, from design to validation and production.
Proactive maintenance can be compared to health care for your test assets, where it is relevant to effectively reduce waste and run an efficient strategy. And investing in proactive maintenance is very low when compared to the cost of an unplanned breakdown.
Today you can plan an efficient maintenance strategy, keeping your assets up and running, saving costs, and creating competitive advantages. An asset optimization strategy can return results in as little as 30 days by reducing:
- Maintenance costs by 25–30 percent
- Equipment breakdowns by 70–75 percent
- Downtime by 35–45 percent
The survey results represented here are based on 813 responses collected from Gartner’s ITScore for Data and Analytics from October 2017 through June 2018.
Next Steps
- Learn how to leverage your data into actionable insights
- Learn how OptimalPlus software can help you improve manufacturing efficiency, quality, and reliability
- Explore NI's SystemLink software provides a central infrastructure of asset management, lab orchestration, and data management and analysis tools