XCP and CCP Trace
- Updated2025-10-13
- 3 minute(s) read
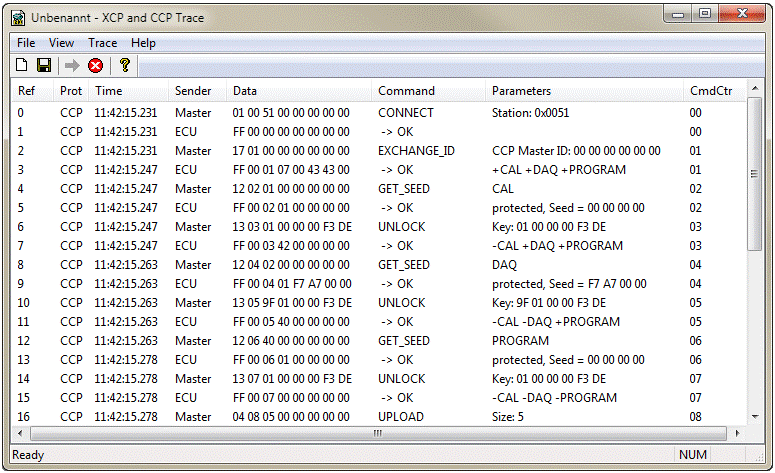
The XCP and CCP Trace tool monitors XCP and CCP protocol communication to aid in the debugging of an application. Launch this tool from the Start menu in Start»Programs»National Instruments»ECUMC XCP and CCP Trace.

The XCP and CCP Trace application monitors, records, and displays XCP and CCP communication commands and parameters called by your ECU M&C application using the XCP or CCP protocol. Use XCP and CCP Trace to analyze your application's communication and to verify that the communication with your ECU slave is correct.
You can use this application only when the ECU M&C application you want to debug is running on the same Windows machine.
XCP and CCP Trace may slow down the performance of your application, communication to your ECU slave, and the entire system. You should use XCP and CCP Trace only while you are debugging or when performance is not critical.
For further information about the displayed XCP or CCP commands and parameters, refer to the ASAM XCP Part 2 Protocol Layer Specification or CAN Calibration Protocol Version 2.1 specification documents.
Saving Captured Communication Data
To save the information displayed in the XCP and CCP Trace capture window, select File»Save As. In the Save As dialog box, specify a name for the capture file. An .xlg extension is typically used for saving XCP and CCP Trace capture information. The XCP and CCP Trace log is stored in ASCII format; you can use any text editor to view the .xlg file.
Capturing Data
Capture is activated
automatically after XCP and CCP Trace is started. To turn capture on, click the
Start button  in the toolbar. To turn capture off, click the Stop
button
  in the toolbar.
XCP and CCP Trace Options
To view or modify the XCP and CCP Trace capture options, select Trace»Options.
Capture
You can specify the types of messages to capture with XCP and CCP Trace. By default, only XCP/CCP commands are enabled. To select the XCP/CCP messages to capture, select Trace»Options, and then select the message types you want to capture:
Call History Depth
Call History Depth determines the maximum number of events that XCP and CCP Trace displays; the default value is 1000. When the number of captured events exceeds the Call History Depth setting, only the most recent calls are kept.