Analysis and Signal Processing with LabVIEW
Overview
Analysis is a fundamental part of many test, measurement, and control applications because it gives you insight into what your data means. Whether you want to perform quick and simple processing on a signal, or build your own highly specialized algorithm, we have the tools to help. LabVIEW Full Development System contains over 850 built-in analysis functions to simplify development for a broad range of applications. Some commonly used libraries include:
- Probability and Statistics
- Optimization
- Linear Algebra
- Curve Fitting
- Vibration and Signal Processing
- Signal Generation
- 34 built-in Filters
- 17 built-in Transforms (including Gabor)
- Spectral Analysis
- PID Control Algorithms*
- Fuzzy Logic*
- Bode Plot*
- Root Locus*
- *Add-on required
See a complete list of analysis libraries included with LabVIEW Full Development System
These libraries contain high-level functions that can be configured to satisfy many common analysis needs, while giving you access to low-level building blocks needed to create fully customized algorithms.
Seamlessly Integrate Analysis Into Your Application
An integrated development environment means you can make decisions based on your data, faster. LabVIEW offers analysis capabilities that work seamlessly with data acquisition and display functions, allowing you to make your first measurements faster and reduce overall development time. By performing analysis inline with data acquisition, your application can quickly respond to changes in your signal as they occur. Using a single tool means that you don't lose time moving data between environments or lose data converting between file types.
Learn more about how LabVIEW can help you analyze, store, and share your data insights.
Integrate Analysis Code from Another Language in LabVIEW
Engineers who want to combine other IP with a built-in graphical user interface or streamlined hardware integration are empowered to choose the most effective approach—textual, graphical, or a combination—for algorithm development, signal processing, control design, and data analysis tasks.
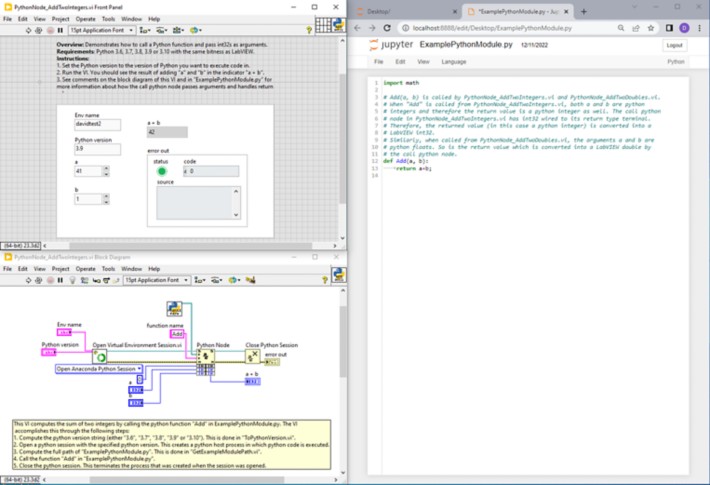
Figure 1. Simple example program using the Python Node in LabVIEW for basic math.
LabVIEW has built-in functions for integrating code from other languages, such as the Python Node (Python), MATLAB Node (MATLAB), Call Library (C/C++), and Constructor Node (.NET). Using these nodes, you can reuse your custom algorithms and bring your text-based routines inline with your data acquisition in the graphical LabVIEW environment.