Data Storage and Reporting with LabVIEW
Overview
The continued increase in processing and storage capacity and the decrease of hardware and software costs has resulted in an explosion of collected data being acquired. But while technology is enabling faster and richer data retention, storing, managing, and sharing data remains the real challenge. Traditional software packages tend to take one of two limiting approaches: 1) they force you into a particular format that is not exchangeable with other applications or users or 2) saving data is left so open ended you waste time trying to determine the best way to organize and save your data to disk so you can share it. LabVIEW, designed for the entire engineering process, includes built-in functionality to help you easily save data to disk and create professional reports. By providing easy yet robust interfaces for file I/O and reporting, you can make the most of your acquired data to make decisions faster.
Contents
- File Read and Write Capabilities to Meet Your Needs
- Custom and Legacy File Format Reading and Writing
- Organizing and Managing Your Data with DataFinder Technology
- Data Reporting to Share Your Results
- Focus on Data, Not Files
- Next Steps
File Read and Write Capabilities to Meet Your Needs
Choosing the right file format for saving data in your test system can be a big decision. You need to pick a format that meets your requirements in your current system, but that can also scale as your test needs change. You have many characteristics to consider when evaluating storage formats:
- File sharing and exchangeability
- Disk footprint
- Simple inclusion of meta information and properties
- Reading and writing speeds
- Working familiarity with the format
As each application is different, LabVIEW contains a wide array of file I/O options for you to choose from, including ASCII, binary, datalog, ZIP, and XML.
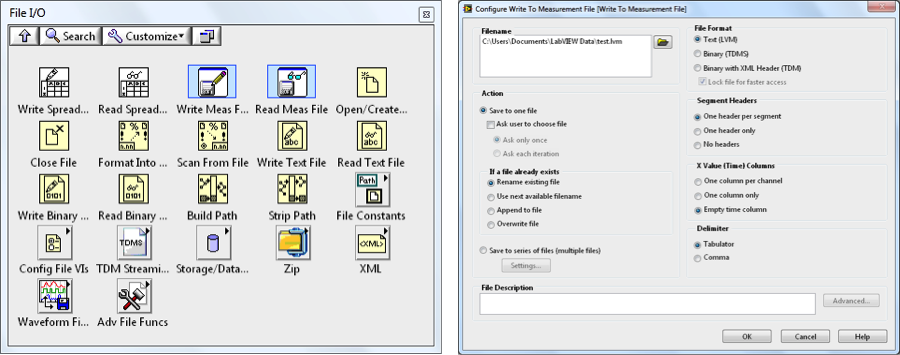
Figure 1: With LabVIEW, choose from many interfaces for reading and writing files, depending on your needs.
As seen in Figure 1, LabVIEW includes basic functions you can use to build files from scratch as well as Express VIs for configuring file I/O parameters from a dialog so you don’t have to worry about details such as opening file references, string formatting, and endianness. Because good file I/O practices can be one of the trickier parts of building any test or measurement system, NI LabVIEW ships with dozens of examples that you can use to get started with each of the file types.
File I/O Designed Specifically for Engineering Data
Despite the fact that LabVIEW offers a wide variety of file I/O options, these traditional file types rarely meet all the criteria you need in a file format. For example, ASCII files are exchangeable, but are very large and slow to read and write. On the other hand, binary file read and write speeds can keep up with high-speed hardware, but are difficult to share with others.
Because of the drawbacks of traditional file I/O, National Instruments developed the Technical Data Management Streaming (TDMS) file format to meet the specific needs and high demands of engineers and scientists. TDMS files are based on the TDM data model for saving well-organized and documented test and measurement data. The TDM data model offers three levels of hierarchy, as shown in Figure 2 – file, group, and channel. The file level can contain an unlimited number of groups, and each group can contain and unlimited number of channels. Because of this channel grouping, you can organize your data to make it easier to understand. For example, you may have one group for your raw data and another group for your analyzed data within one file, or you may have multiple groups that correspond to sensor types or locations.
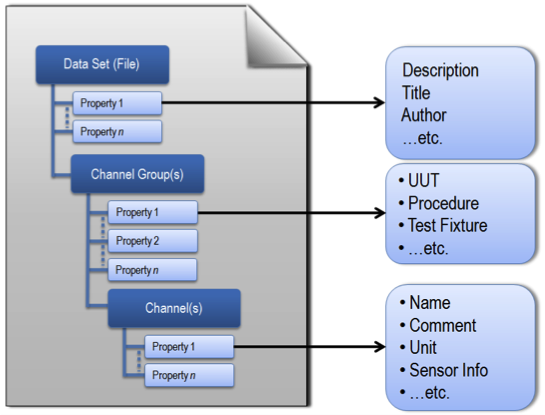
Figure 2: The TDM data model meets the specific requirements of measurement data.
Also, you can insert your own custom properties at each of the three levels. Each level accepts an unlimited number of custom-defined attributes to achieve well-documented and search-ready data files. The descriptive information located in the TDMS file, a key benefit of this model, provides an easy way to document the data much like you would document code. As your documentation requirements increase, you do not have to redesign your application, you simply extend the data model to meet your needs.
Multiple Easy-to-Use Programming Interfaces
Because it was developed to meet the needs of all engineers, TDMS offers ease of use, high-speed streaming, and exchangeability. Like many operations in LabVIEW, you can use multiple interfaces to write TDMS files. You can quickly read and write TDMS files using a virtual instrument (VI) such as the Write To Measurement File Express VI or, for the best performance and customization, use the primitive TDMS VIs from the File I/O palette. Also, when using LabVIEW with NI-DAQmx, you can use the Configure Logging VI from the DAQ palette or log directly from the NI DAQ Assistant, as seen in Figure 3.
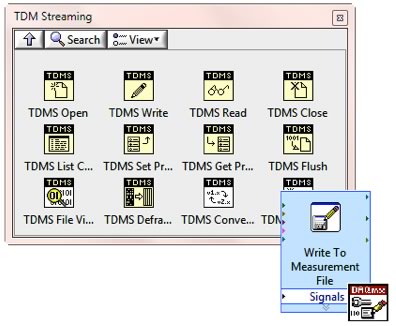
Figure 3: With multiple interfaces for writing TDMS files, you can choose the one that best fits your needs.
High Streaming Speeds
Although TDMS is designed to be easy to use, with the major speed improvements in hardware over the last several years, it is also important for TDMS to be optimized for high-speed streaming so that file I/O is not the bottleneck when determining your acquisition speeds. With under-the-hood optimizations for bypassing buffering, TDMS is the fastest way to write data on the NI platform. So far, TDMS has been tested to stream data up to 3.6 GB/s.
Files Exchangeable with Other Programs such as Microsoft Excel
Because you may be required to work in additional applications, TDMS is easily exchangeable across other programs. You can open TDMS files in Microsoft Excel using the TDM Excel Add-In, which installs with NI software and is available free at ni.com. You also can use a C DLL for reading and writing TDMS files in other programming languages. NI is committed to helping you write well-organized and documented data using the TDMS file format, regardless of which products you use.
Custom and Legacy File Format Reading and Writing
Although ideally you can choose the file format for each application you work on, you may still be restricted to reading and writing in a custom format due to legacy files or hardware that uses custom formats. Understanding that many engineers face this challenge, NI developed the DataPlugin technology so that you can use these custom formats in LabVIEW. As seen in Figure 4, a DataPlugin acts as a file parser that tells LabVIEW and other NI software how to read your custom file formats and maps them to the TDM hierarchy model in memory.
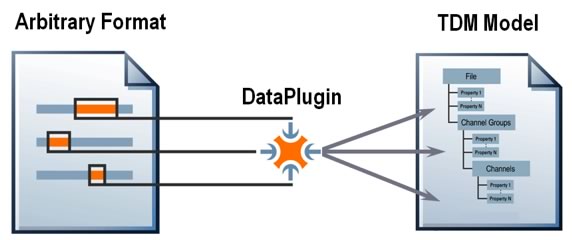
Figure 4: Using a DataPlugin, you can map any file format onto the TDM data model.
National Instruments provides more than 200 free, downloadable DataPlugins for the most common file formats. For custom formats, you can create your own DataPlugins in LabVIEW and NI DIAdem software using a documented API, or request that an NI expert create a DataPlugin for you. Using DataPlugins, you are no longer limited by custom formats and applications, and have options for how to use your data.
Organizing and Managing Your Data with DataFinder Technology
With many applications, the amount of data being collected can quickly become overwhelming. Typically, at that point, you might turn to a database to begin storing your data for faster search and trending. National Instruments makes it easy to interact with a database using the LabVIEW Database Connectivity Toolkit by abstracting the low-level structured query language (SQL) queries. However, moving your existing data to a database, maintaining the database, and creating applications for accessing data can become extremely costly and time-consuming.
In response to this challenge, NI developed NI DataFinder technology, included in the LabVIEW DataFinder Toolkit and DIAdem, for managing test files without the headache and expense of setting up and maintaining a large database. With NI DataFinder, you can perform Internet-like searches across all your data files, regardless of format and location within your company intranet. Simply point NI DataFinder to the location of your data files, and within seconds you can search for your files just as you would search for information on the Internet.
NI DataFinder automatically builds and maintains an index of all files that meet the file type and location criteria in the NI DataFinder configuration. You can use properties automatically stored in the NI DataFinder index in query conditions. When a valid data file is created, deleted, or edited, NI DataFinder automatically notices and reindexes the hierarchy and properties of the file. When you save properties not yet in NI DataFinder in a newly created file, these properties are automatically added to the index. NI DataFinder dynamically manages its own data tables and updates them based on file events and the contents of each file. Therefore, unlike many expensive database solutions, you can change and add information as your needs change without redesigning your data management solution. Using the NI DataFinder, you can quickly find trends and correlations in the large amounts of data you have saved during your tests.
Data Reporting to Share Your Results
Once you have stored your data to file, analyzed it, and searched it for results and trends, you need to be able to share your results with others in a way that easily conveys your findings. Reporting focuses on visualization and exchangeability of your final results as opposed to the entire data set that you store in the file. Although a VI front panel is a great way to visualize and interact with your live data as it is acquired, it is not designed for reporting the final results. With LabVIEW, you can easily create reports on the fly or use templates to automate reporting. You have the option to create output reports in common file formats such as HTML, PowerPoint, and PDF.
Simple Data Report Creation
For basic reporting, LabVIEW comes with built-in VIs for creating text and HTML reports. You can use simple VIs for building up a report programmatically, or use the Report Express VI to configure your report parameters and output all in one window, as seen in Figure 5.
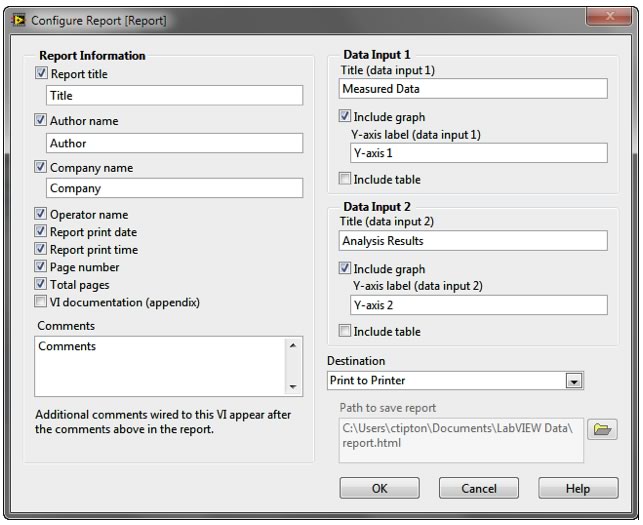
Figure 5: You can configure professional reports using the Report Express VI in LabVIEW.
Interacting with Microsoft Excel and Word
Additionally, you may want to send reports directly to Microsoft applications such as Excel and Word. You can do this programmatically using ActiveX or the LabVIEW Report Generation Toolkit, which is included in LabVIEW Professional. The Report Generation Toolkit abstracts the complexities of interacting with Excel and Word and allows you to focus on designing the actual report elements. Using these VIs, you can easily add headings, tables, and graphs to your Microsoft documents. Also, you can create templates in Word and Excel that can be called from LabVIEW for more automated and standardized reporting.
Designing Flexible and Automated Report Templates
By creating templates, you can easily automate custom reports to update with new data and results. Using DIAdem data management software, you can interactively create report templates that include graphs, tables, and graphics, and call these templates from LabVIEW using the DIAdem Report Express VI. Once you have created the template, all you need to do is wire in your data sources and run the application. Each time you run it, the template updates the data and outputs to common formats such as PowerPoint and PDF files (as shown in Figure 6) which you can easily share. Also, because the DIAdem reporting engine is designed for large data sets, you aren’t limited in the amount of data you can include in your report.
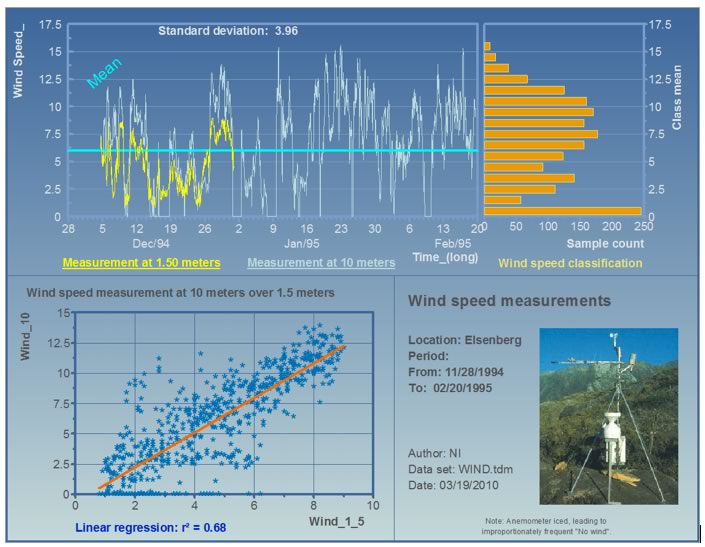
Figure 6: You can output DIAdem reports to common report formats for sharing with others.
Using reporting capabilities in LabVIEW, you have several options for creating visually compelling reports to share your results. Also, with the end user in mind, you can print these reports to common formats that encourage the exchanging of results.
Focus on Data, Not Files
LabVIEW storage, management, and reporting tools are designed to abstract the details and the challenges of file I/O and reporting so that you can focus on the acquisition of the data. With the TDMS file format for engineering data, DataPlugins for your legacy files, the NI DataFinder for searching, and powerful reporting tools, you do not have to restrict your acquisition based on the limitations of storage and reporting. As hardware becomes faster and storage becomes cheaper, LabVIEW continues to provide tools to help you get the most out of all the data you are collecting.