Navigating InstrumentStudio
- 已更新2026-07-23
- 閱讀時間為 4 分鐘
Navigation features, interface elements, and project file structure in InstrumentStudio.
Overview
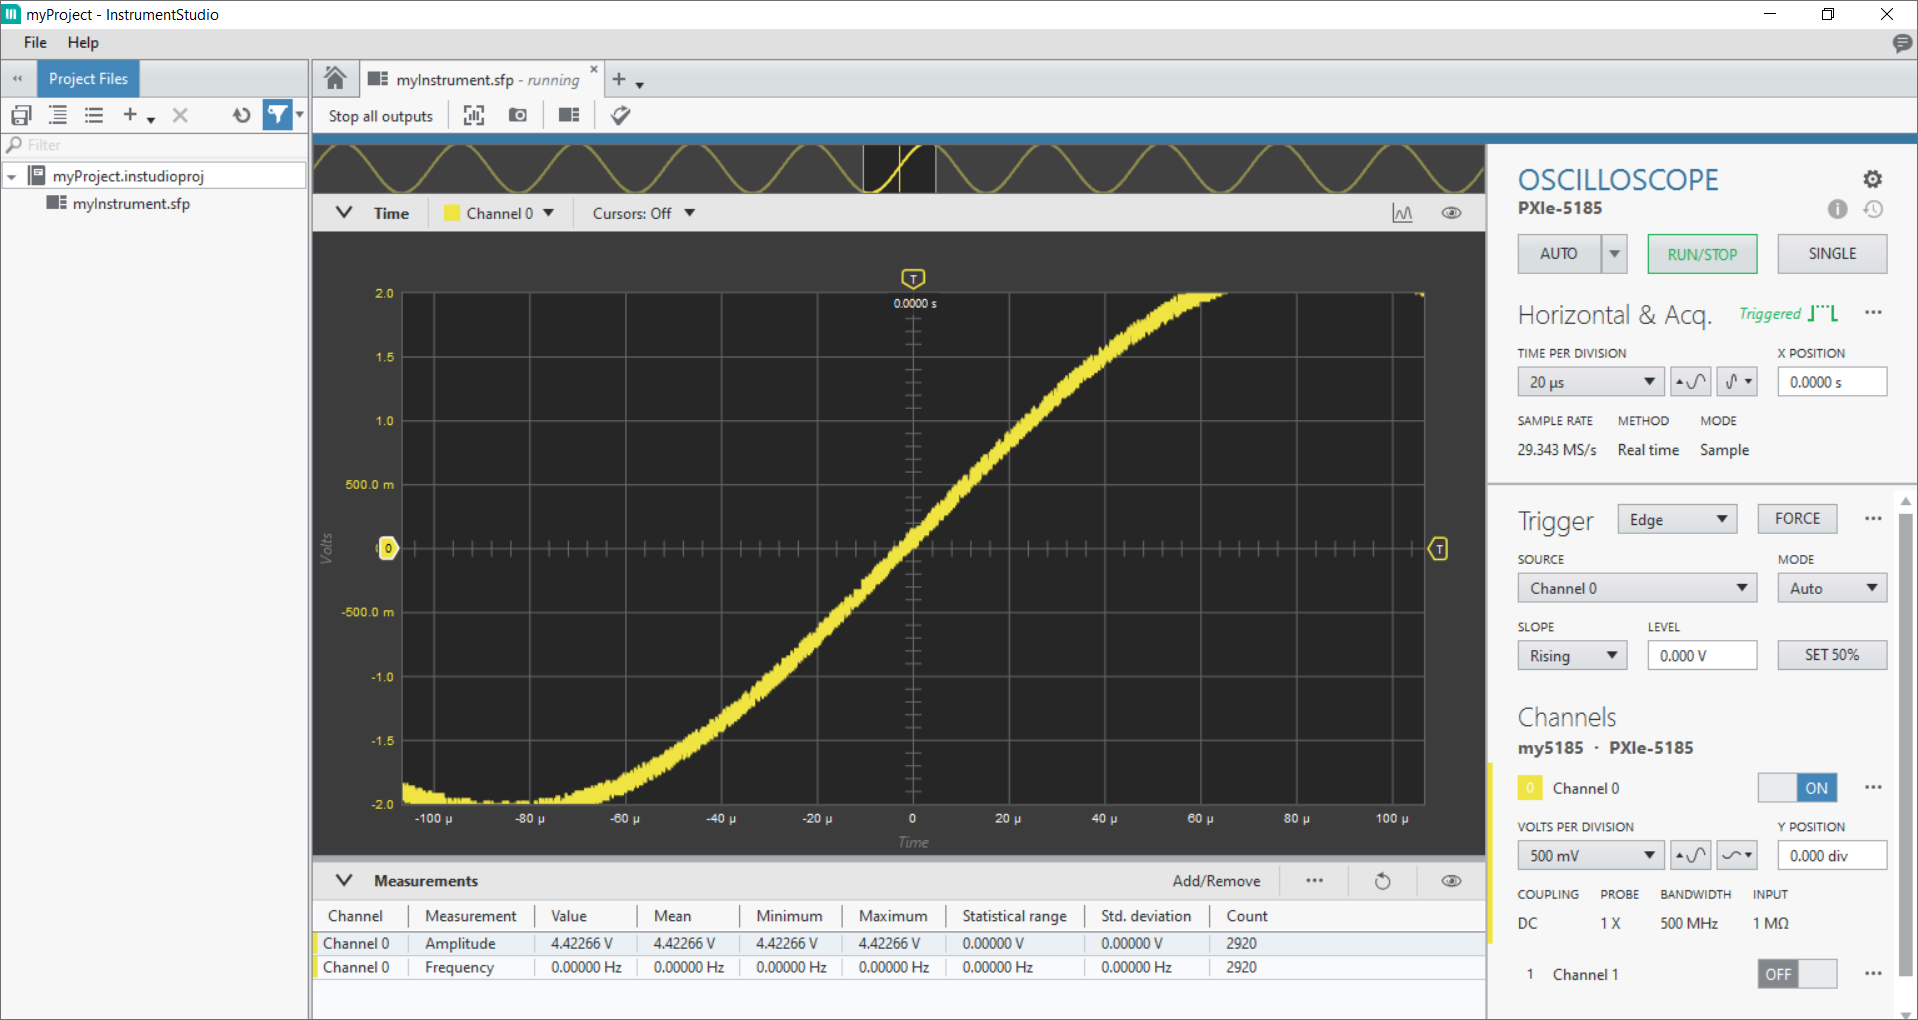
InstrumentStudio organizes instruments, measurements, project files, and related configuration data within a project.
The InstrumentStudio user interface includes the following elements:
- Navigation panes, such as Project Files, Nigel, and Sequencer
- The Measurements table
- Instrument configuration panels
- The Instrument Settings menu
- The Instrument Header menu
- Measurement graphs
Project Files Pane
- Data files
- Saved configurations
- Scripts
- Pin maps
- Other supporting files
- Create
- Rename
- Delete
- Import
- Export
- Search
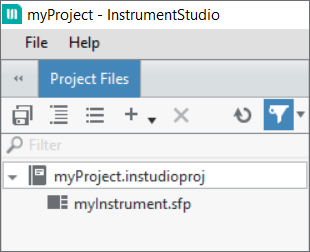
Use the Project Files pane to manage the files associated with an InstrumentStudio project, including device configurations, pin maps, captured data, and supporting files.
| File Type | Description |
|---|---|
| InstrumentStudio project (.instudioproj) | Contains the instrument panels added to your layout, device configurations, pin maps, captured data, and other project files. |
| Soft front panel (.sfp) | Contains the settings selected for each instrument in your layout. |
| Pin map (.pinmap) | Defines how instruments and hardware connect to device under test (DUT) pins and sites. |
| Technical Data Management Stream (.tdms) | Stores data created by taking a snapshot of a graph. InstrumentStudio saves these files by default in the folder that contains your project. |
| Portable Network Graphic (.png) | An image of a graph created by taking a snapshot. InstrumentStudio saves these files by default in the folder that contains your project. |
Nigel Pane
The Nigel pane provides access to NI Nigel AI within InstrumentStudio.
You can use Nigel to:
- Ask questions about InstrumentStudio features and workflows.
- Receive context-aware assistance based on the active project and connected devices.
- Perform supported actions.
- Explore Measurement Data Services data.

Sequencer Pane
 This feature is only available with an InstrumentStudio Professional license.
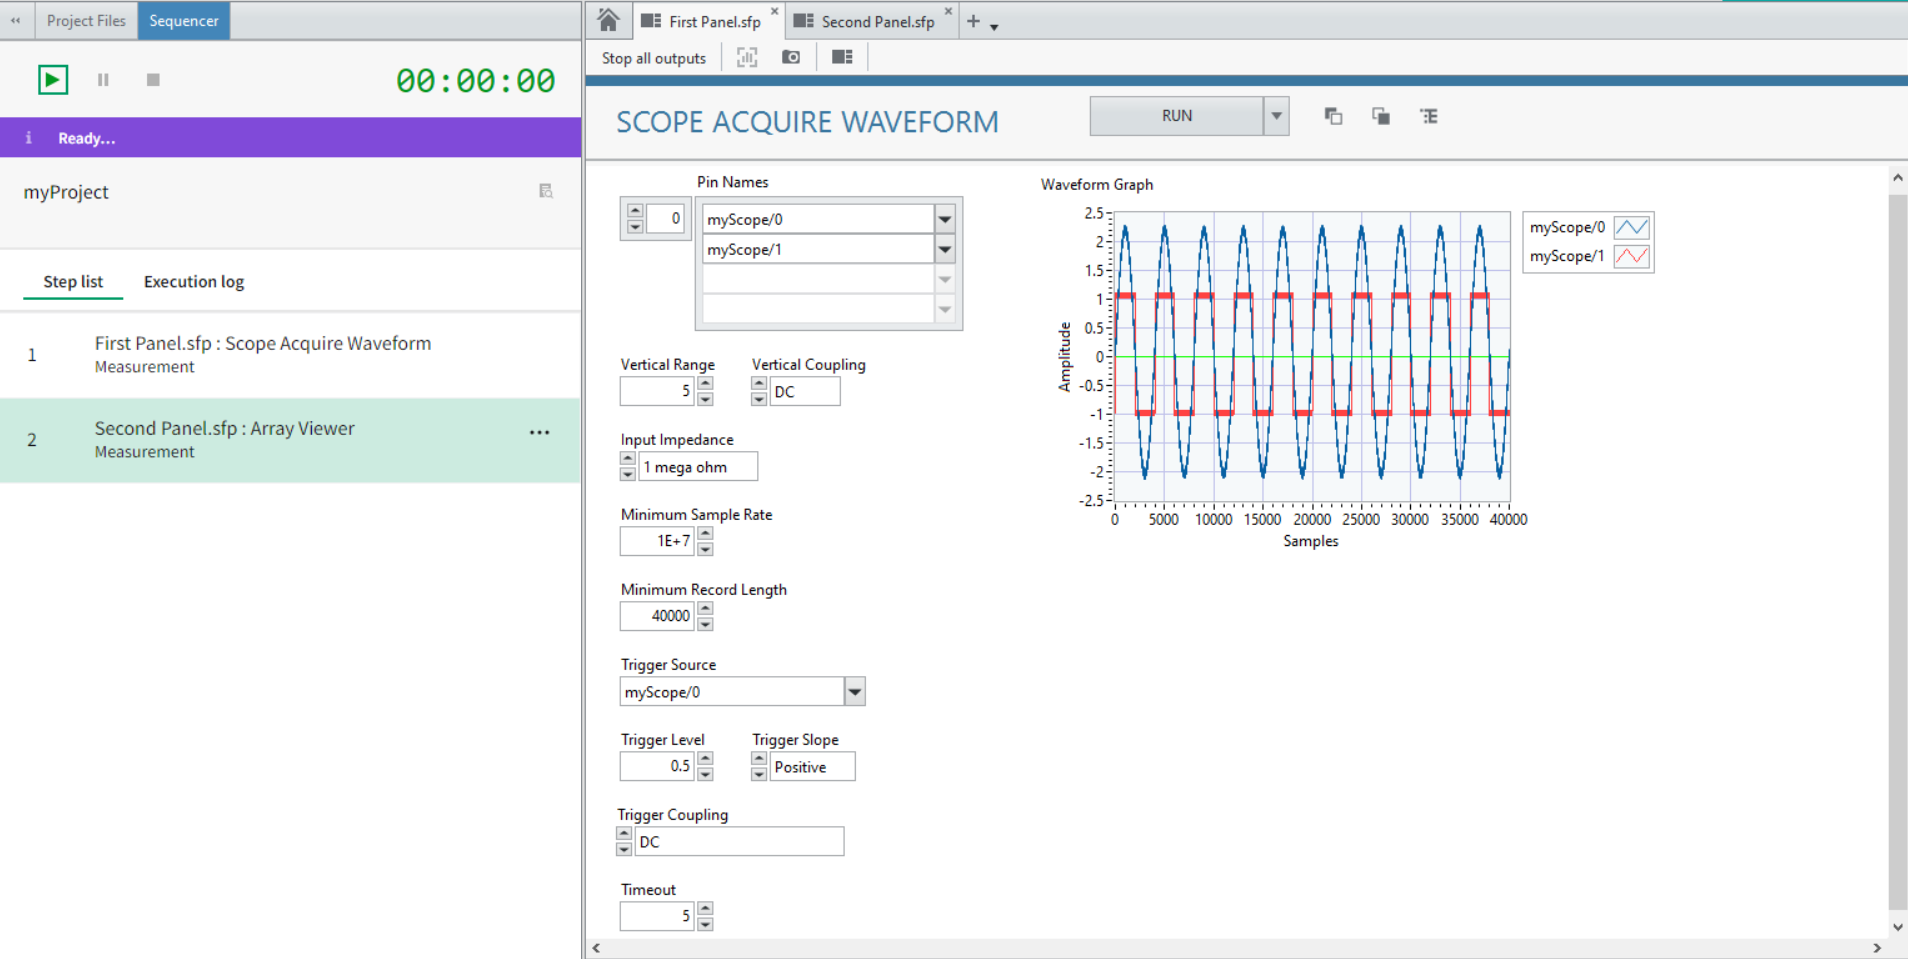
- Create and modify measurement sequences
- View measurement panels associated with sequence steps
- View execution results in a sequence log
Measurements Table
- Measuring signal properties
- Analyzing signal characteristics
- Performing stimulus response tests

Instrument Configuration Panel
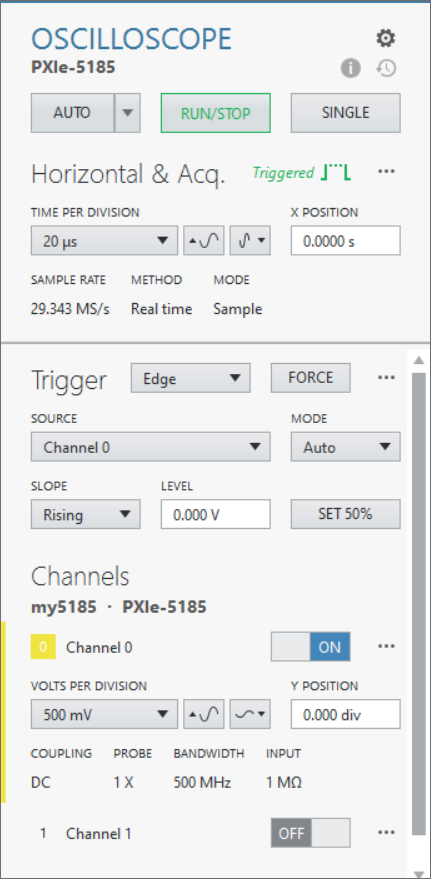
The Instrument Configuration panel allows you to configure instrument settings and monitor instrument status.
Instrument Settings Menu
You can access the Instrument Settings menu ( ) from the upper-right corner of the Instrument Configuration
panel.
) from the upper-right corner of the Instrument Configuration
panel.
The available actions depend on the panel type.
The instrument settings menu allows you to:
- Export and import configurations
- Capture data
- Access device-specific actions and information
- Add or remove devices
- Configure debug sessions
- Delete panels
- Configure data sources
- Configure panel-specific settings, such as power line frequency
Use this menu to access panel management, data capture, and debugging features.
Instrument Header Menu
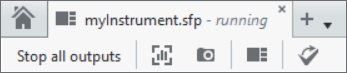
- Stop all outputs
- Create new instrument panels (
 )
) - Capture data (
 ) and screenshots (
 )
) - Edit layouts (
 )
) - Export to TestStand (
 )
)
Measurement Graphs
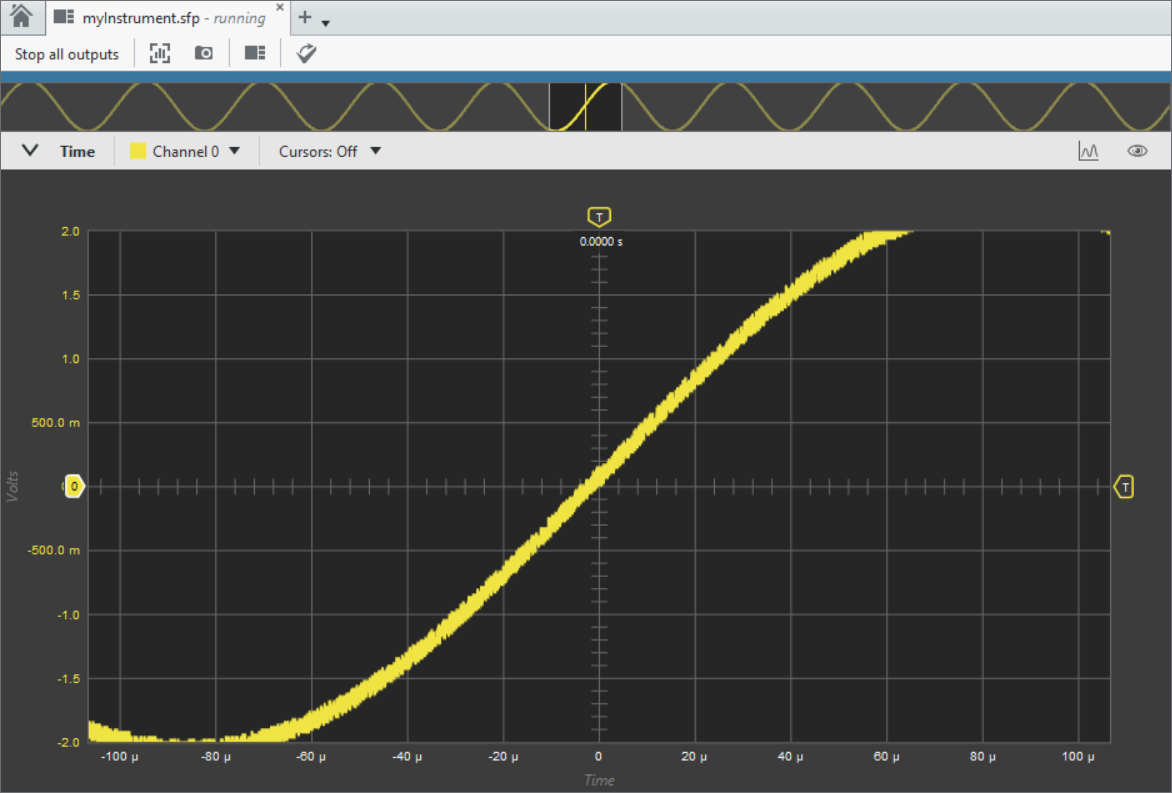
Measurement graphs allow you to visualize data from connected instruments and interact with measurement results.
You can:
- Zoom
- Pan
- Create annotations
相關內容
- NI TDMS File Format - What is a TDMS File?
- NI Nigel AI in InstrumentStudio
Information about using NI Nigel AI to obtain guidance, perform supported actions, and explore measurement data within InstrumentStudio.
- Sequencer Tool
The sequencer tool allows you to perform a series of ordered tasks using instrument panels and measurement plug-ins. Automation with the sequencer tool allows you to efficiently perform multi-step measurements, saving time and ensuring consistency.