Using the 3-D Parametric Surface Graph in LabVIEW
The 3-D parametric surface graph is the most complex of the 3-D surface and the most difficult with which to work. The key to understanding the 3-D parametric surface graph is in understanding that the surfaces are described parametrically with 2 parameters -- call them i and j. Therefore, in order to draw a three dimensional surface, we need three equations:
y = fy(i, j)
z = fz(i, j)
We then plot these three equations into three matrices, using the indices of the arrays for our i and j values:
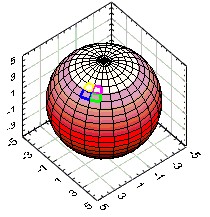
A good example of how to use parameterized equations is converting from spherical to Cartesian coordinates and drawing a sphere. The equation for a sphere in spherical coordinates is quite simplistic:
To parameterize this we will simply convert the equation into Cartesian coordinates using the standard transform:
y = r sin(q)cos(f)
z = r sin(f)
Running q from 0 to 2p and f from -p to +p generates all of the points in the sphere. Hence this is the Cartesian form of a sphere parameterized in q and f. However, we don't really want all the points in the sphere, (since that would take an infinite amount of time to plot!). Rather, we would like a few representative points from which we can draw the sphere. These we will place into our arrays. Remember that i and j, the indices of the arrays will ultimately become our parameters, so we must also convert q and f to i and j.
First, we must choose an array size to contain the points. This is largely a decision of how many points are deemed necessary to sufficiently represent the structure. For this example, I will choose arrays that are 25 by 25 elements. Therefore, both i and j will run from 0 to 24. Using this, we must map q to i and f to j (or vice-versa).
Note that for ,
, and for
,
. Therefore, rewriting the equations:
With these three equations, we can fill three matrices with values for x, y, and zbased on the parameters i and j, which are the indices of the values in the array.
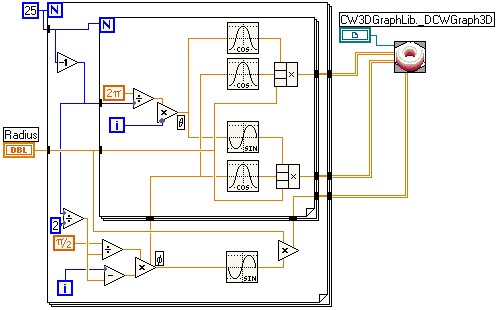
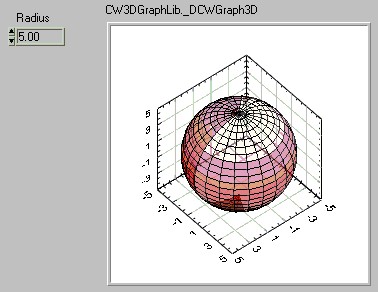
Now all that is left is to plot the arrays using the 3D Parametric Surface graph. You can add this control to front panel by navigating through the Controls palette > Classic > Graph > ActiveX 3D Parametric Graph. Then configure the block diagram using LabVIEW's trigonometric functions in nested for loops to resemble the functions discussed above (see figure below for example).
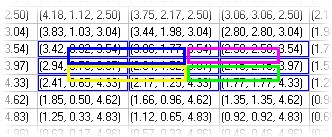
Another way of thinking about the 3-D parametric surface graph is to think of the arrays as one 2-D array of 3-D vectors, (rather than three 2-D arrays of scalars). With this concept, we can easily see that the 3-D graph draws a rectangle for each set or four adjacent elements of the array. In the pictures below, we see a portion of this sphere's data array represented as a 2-D array of 3-D vectors. Notice that every adjacent cell generates a rectangle on the 3-D representation.