Using the NI Digital Waveform Editor to Analyze Waveforms
Overview
This document starts by exploring the common features of a logic analyzer used in viewing and analyzing digital data. The article then dives into how the NI Digital Waveform Editor can be used in conjunction with NI products, such as the NI Logic Analyzer solution, to view and analyze digital waveforms in a graphical and interactive environment.
Contents
- Need for Digital Data Analysis
- Overview of the Digital Waveform Editor
- Incorporating the NI Digital Waveform Editor with the NI Logic Analyzer Solution
- Features of the NI Digital Waveform Editor for Analyzing Digital Data
- Additional Resources
Need for Digital Data Analysis
A logic analyzer is an instrument that captures the response of a digital system for use in debugging and verifying its operation. In order to capture the necessary data, logic analyzers provide the ability to trigger the start of an acquisition, whether it be through a software command or complex sequential pattern matching, as well as the ability to probe or connect to the digital system under test.
Once the data has been acquired, a logic analyzer needs to provide the users with a familiar, easy-to-use interface that allows them to quickly analyze the acquired digital data, which can sometimes be millions of samples long. At the very minimum, a logic analyzer's user interface includes the ability to simultaneously view and analyze multiple channels of digital data so that the state of the digital system can be viewed and the timing relationships between signals determined. The display on most logic analyzers allow users to pan through the acquired data and mark sections of the data for easy location later.
Recent PC-based logic analyzers allow engineers to use the familiar operating environment of their desktop computer to acquire, analyze, and present their digital data. NI offers a Logic Analyzer and Pattern Generator solution that combines interactive software with modular hardware. By leveraging the performance and flexibility of the standard PC, users can store an almost unlimited amount of acquired data to be analyzed by custom algorithms or quickly viewed with software packages, such as the NI Digital Waveform Editor. This paper takes a look at how to get started with the NI Digital Waveform Editor and some of its key features that can be used to view and analyze digital signals.
Overview of the Digital Waveform Editor
The NI Digital Waveform Editor is an interactive software tool for creating, editing and importing digital waveforms. The software provides a straightforward user interface for viewing and analyzing large numbers of digital waveforms graphically. While usually used for creating new digital waveforms with automatic fill patterns, with the NI Digital Waveform Editor you can leverage the powerful, interactive environment to display and analyze signals after acquisition. With features such as searching, bookmarks and cursors, the NI Digital Waveform Editor offers a simple but effective interface for managing digital data.
Furthermore, you can link the design and test of your digital device together by importing existing test vectors in ASCII or Value Change Dump (.VCD) file formats from popular spreadsheet and digital simulation packages. This allows you to use a single environment for viewing data not only acquired from your device under test but also from the simulation phases of your product.
Incorporating the NI Digital Waveform Editor with the NI Logic Analyzer Solution
The NI Logic Analyzer solution combines an NI 100 MHz Digital Waveform Generator/Analyzer instrument with NI SignalExpress and the NI Digital Waveform Editor application software. This PC-Based logic analyzer solution allows the full power of the computer to be used to perform complex analysis, data logging, and report generation. SignalExpress is a software environment that allows you to interactively create analysis and acquisition programs without requiring any knowledge of programming. Once data is acquired with SignalExpress, you can view, analyze, and edit your saved digital data in the NI Digital Waveform Editor by navigating to Tools » Digital Waveform Editor... in the SignalExpress menu. Once the NI Digital Waveform Editor screen has launched, you can uses the features discussed below to open and analyze your data.
Features of the NI Digital Waveform Editor for Analyzing Digital Data
a. Import Acquired or Simulated Test Vectors
Although not as flexible, ASCII files and Value Change Dump (VCD) files are also commonly used to store digital data, especially from many simulation and design packages. ASCII files represent standard text files that can be opened by all common spreadsheet and word processing applications. VCD files are based on the IEEE 1364-2001 standard and are the common file format used to save data from industry-standard Electronic Design Automation (EDA) computer-aided design (CAD) tools.
Opening an HWS file
To open an HWS file, such as one saved from an acquisition program in SignalExpress, select File » Open Waveform… to open a dialog box where you can select the desired waveform file. Navigate to an HWS file and click “open.”
Importing an ASCII file
To import an ASCII file, select File » Import » From ASCII... to launch the ASCII Import Wizard. Follow the instructions in the wizard to select the source file, data representation, column delimiters, start row and start column, and the number of columns and rows to import. You can also specify whether the first row is imported as the signal names, which appear to the left of the data on the waveform graph. Use the Data Preview portion of the dialog box to verify that the selected settings will import the desired data from the ASCII file.
Importing a VCD file
To import a VCD file, select File » Import » From VCD... to launch the VCD Import Wizard. The VCD Import Wizard guides you through a three-step process for selecting the signals to import, configuring a sampling method, and identifying whether the signal is drive or compare data. The first step allows you to select the VCD file, to configure options for importing data, and to view information about the data. The second step allows you select a sampling method for the signals in the VCD file. Your choice of sampling method specifies how the Import Wizard converts the asynchronous VCD file into a synchronous, discrete set of test patterns. In the third and final step of the wizard, you configure how the X (don't care) and Z (tristate) states are imported.
b. Cursors
The NI Digital Waveform Editor has two cursors that can help in analyzing the timing relationships. To enable the cursors, navigate to View » Show Cursors. You can then use the cursors to measure the distance between two edges on a digital signal. Use the mouse to drag the cursors across your digital signals. The Cursor Delta, shown in the status bar at the bottom of the waveform graph, displays the difference in samples and time of where the two cursors are positioned.
c. Zoom Tools

- Zoom In - Use the Zoom In tool to change the number of samples visible in the waveform graph to half the current number of samples. The sample in the far left location on the waveform graph remains the same.
- Zoom Out - Use the Zoom Out tool to change the number of samples in the waveform graph to twice the current amount. The sample in the far left location on the waveform graph remains the same, except when the end of the waveform is reached, in which case the left sample viewed is adjusted to accommodate the desired number of samples.
- Zoom to Selection - Use the Zoom To Selection tool to cause the currently highlighted samples to fit within the viewing area. If the highlighted area is smaller than the viewing size, the Zoom To Selection tool places the leftmost sample of the highlighted area on the left of the graph and zooms only to the minimum viewing size. (NOTE: This option is only available when a portion of the waveform is highlighted.)
- Show Entire Waveform - Use the Show Entire Waveform tool to zoom in or out to place the entire waveform in the waveform graph.
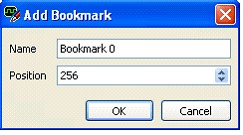
d. Bookmarks

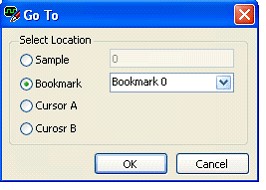
To return to a previously created bookmark, right click on the display, choose Go To… and specify the bookmark you wish to view.

e. Search for Pattern