Assigning Processor Affinity in LabVIEW to Optimize Multicore Performance
Overview
Contents
- Automatic Multi-threading in LabVIEW
- Assigning Processor Affinity in LabVIEW
- Example Application
- Summary
Automatic Multi-threading in LabVIEW
By default, LabVIEW will automatically multi-thread an application into various tasks, which are then load balanced by the operating system (Windows, MacOS, Linux, LabVIEW Real-Time, etc.) across the available processor cores. It is recommended that developers take advantage of this behavior, because typically the operating system scheduler does an excellent job of dividing the load between processors, as illustrated below in Figure 1.
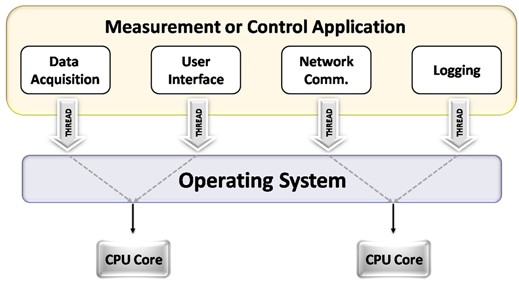
Figure 1 - Measurement or Control Application divided into tasks which can be automatically balanced on a multicore processor with LabVIEW
Assigning Processor Affinity in LabVIEW
In some applications (particularly Real-Time control applications), it may be desirable to specifically assign a task to it's own dedicated core. For example, a time critical task such as a control loop could be implemented in this manner. This allows the remaining tasks in the system to share the other processor resources amongst themselves—and ensures nothing interferes with the time critical process.
As of NI LabVIEW version 8.5 the Timed Loop and Timed Sequence structures include a Processor input that allows you to manually assign available processors to handle the execution of the structures. You can configure the processor assignment by wiring an input to the Processor input of the Input Node for the structure or for frames of the structure. (See Figure 2 below)
You also can configure processors to handle timed structures in the Processor Assignment section of the Configure Timed Loop dialogue window. Double-click the Input Node or right-click the structure and select Configure Timed Loop to display the Configure Timed Loop dialog box, where you can configure the Timed Loop. The values you enter in the Configure Timed Loop dialog box appear next to the input terminals on the Input Node. (See Figure 2 below)
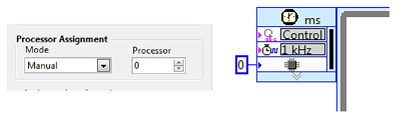
Figure 2 - The two methods to assigning processor affinity using the Timed Loop
Note: If you load a VI with a timed structure from a previous version of LabVIEW, the Processor input sets to 0 by default, where 0 represents the first available processor in the system, because all timed structures automatically run on processor 0 in previous versions of LabVIEW.
Example Application
Consider the following application, where there are two primary loops dividing the application into a time critical task (Control and I/O) and a non-deterministic task (Monitoring, Simulation, and Network Communication). Assume the application is running on a dual-core PXI Real-Time controller—so there are two available processor cores for these tasks to run on.
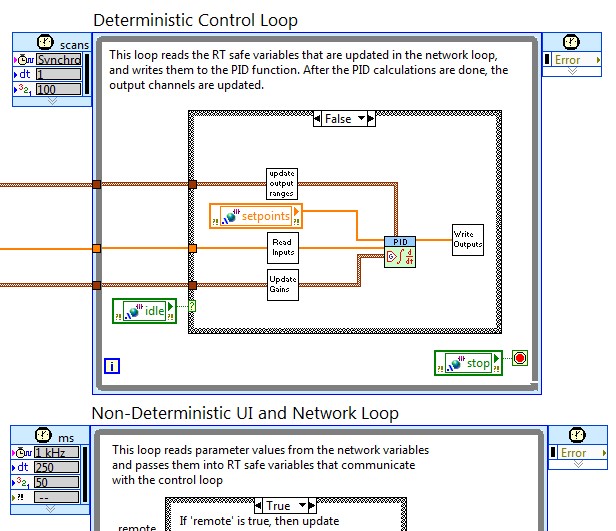
Figure 3 - Example LabVIEW Real-Time control application
Both of the Timed Loops are processing intensive, so the operating system will auto-load balance the tasks across the two available cores. In addition, there is networking overhead that must be scheduled (i.e. the processing required by the shared variables to pass data over the network). By examining a trace in the Execution Trace Toolkit 2.0, we can observe that even though the CONTROL task is time-critical, it is sharing CPU 0 with the shared variable processing (denoted by NILXTCORE, or NI Logos XT). The MONITORING task, which is dimmed in this view, is using up the other CPU.
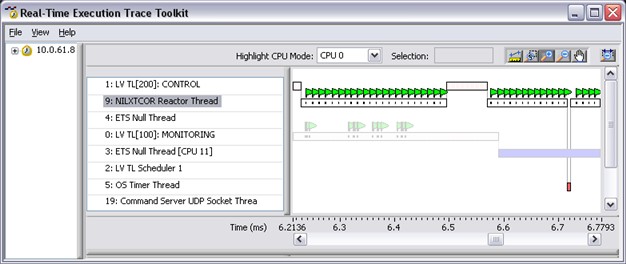
Figure 4 - Example Trace of the application, with the CONTROL task sharing a CPU with network communication
Note how the Real-Time Execution Trace Toolkit allows for simultaneous viewing of threads running on different CPUs, this capability is ideal for debugging parallel applications.
If desired, the Timed Loop parameters could be modified to dedicate the CONTROL task to it's own CPU. This is accomplished by changing the Automatic processor assignment to Manual, and then choosing which particular CPU to assign the task to.
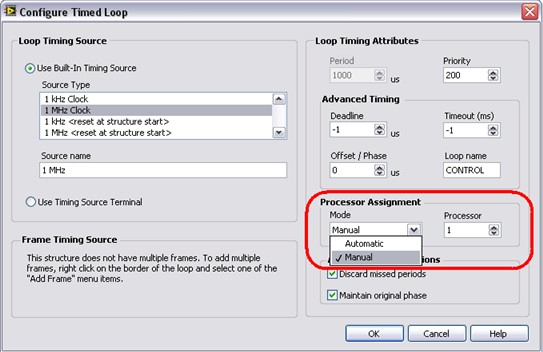
Figure 5 - Assigning CONTROL task to CPU 1 using Processor Affinity
Now, a second trace session can be viewed to see what this change in behavior did to our application. In this scenario, the CONTROL task is dedicated to it's own CPU, and the ETS Null Thread is shown, which signifies that the operating system is not scheduling anything else during the span denoted in blue. In other words, the CONTROL task has CPU headroom to allow for enhancements to the application such as tighter control loops or the addition of more in-line processing.
Also note the dimmed section of this trace, which shows that now MONITORING task and networking tasks are sharing the other processor, which is the desired behavior.
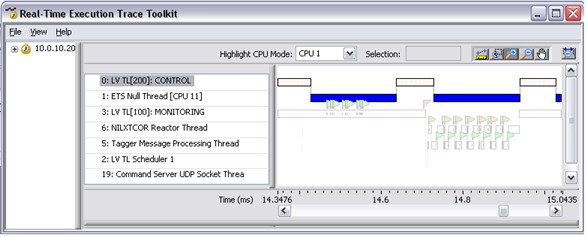
Figure 6 - Example Trace of the application, with the CONTROL task dedicate to it's own CPU
Summary
With the capability to explicitly assign tasks in LabVIEW 8.5 to processors in a multicore system, developers can optimize control applications by dedicating a specific task to it's own processor. This complements the default, automatic multi-threading behavior in LabVIEW that has been natively supported since version 5.0.