Performing Order Analysis in LabVIEW with Sound and Vibration Software
Overview
With the National Instruments Sound and Vibration Measurement Suite, you can build custom LabVIEW-based measurement and automation applications with order analysis capabilities for order tracking, order extraction, and tachometer signal processing. The Suite employs Gabor Order Tracking, a patented algorithm based on joint time-frequency analysis (JTFA), as well as conventional resampling for online processing capability.
Included in the Sound and Vibration Measurement Suite is a set of VIs that you can drag and drop to build custom LabVIEW applications, enabling you to perform the following analysis operations:
- Calculate and examine rotational speed
- Measure power distribution in the frequency or order domain as a function of either time or rotational speed
- Extract order components from noise or vibration signal
- Measure magnitude and phase of any order component as a function of rotational speed
- Present data in a waterfall, orbit, bode, or polar plot
Contents
- Sound and Vibration Order Analysis VIs Explained
- Order Analysis Example VIs
- Order Analysis Function and Description List
- Demonstrations
- Pricing and Purchasing
Sound and Vibration Order Analysis VIs Explained
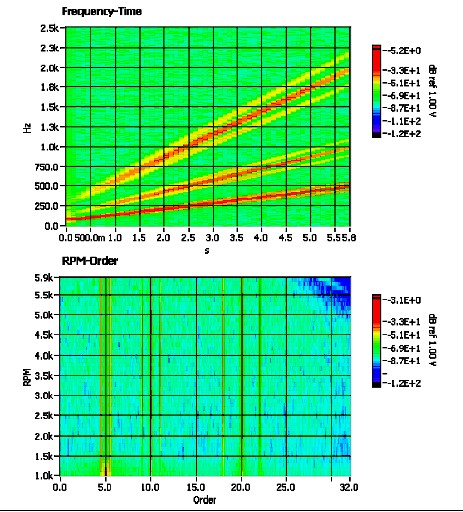
Figure 1: Frequency-Time and RPM-Order Data Plotted Using NI Sound and Vibration in LabVIEW
Order analysis is a powerful tool used to study, design and monitor rotating or reciprocating machinery for which the rotational speed might change over time. As with frequency-domain analysis, you can think of order analysis as a signal scalpel that can dissect sound, vibration, and other dynamic signals into components that relate to physical elements of mechanical systems. From this, you gain a better understanding of the system and can identify characteristics that change with time and operating conditions. Unlike the power spectrum and other frequency-domain analysis standards, order analysis works even when the signal source undergoes rotational speed variations or frequency/Doppler shifts.
The Order Analysis VIs included in the Sound and Vibration Measurement Suite present the capability to calculate and examine rotational speed and extract the order components from the original noise or vibration signal. Power distribution can be measured as a function of either time or rotational speed and measuring the phase and magnitude of any order component as a function of rotational speed is made easy. Data is displayed in waterfall, orbit, polar, or bode plots.
In addition to several advanced VIs that provide flexibility and increased control of the analysis process, this toolkit also includes a set of Express VIs which allow you to perform simple without much programming. The toolkit also comes with extensive examples which demonstrate fundamental order analysis tasks such as data acquisition, data presentation, Gabor order tracking, and resample order tracking for both analog and digital tachometer signal processing. By leveraging these examples, you can develop applications much quicker.
You can apply order analysis to dynamic signals generated by mechanical systems that include rotating or reciprocating components, such as turbines, compressors, pumps, and engines. It is common to use order analysis in applications such as machine condition monitoring (MCM) and noise, vibration, and harshness (NVH) testing. With the added capability for online processing, you can easily create flexible applications for condition-based monitoring and predictive maintenance. The National Instruments NI Dynamic Signal Acquisition devices are ideal for acquiring sound and vibration signals with 24-bit A/D converters and anti-aliasing filters.
Order Analysis Example VIs
The Sound and Vibration Measurement Suite includes easy-to-use Example VIs for the most common applications including:
- Analog Tachometer Signal Processing
- Order Power Spectrum
- Spectral Map Analysis for Waterfall and Colormap Plots
- Order Tracking - Magnitude and Phase
- Order Waveform Extraction
The following VI is an example that uses the Sound and Vibration Measurement Suite. This VI demonstrates how to compute an order power spectrum with averaging. This VI uses DAQmx VIs to acquire sound or vibration signals and an analog tachometer signal and displays the order power spectrum continuously.
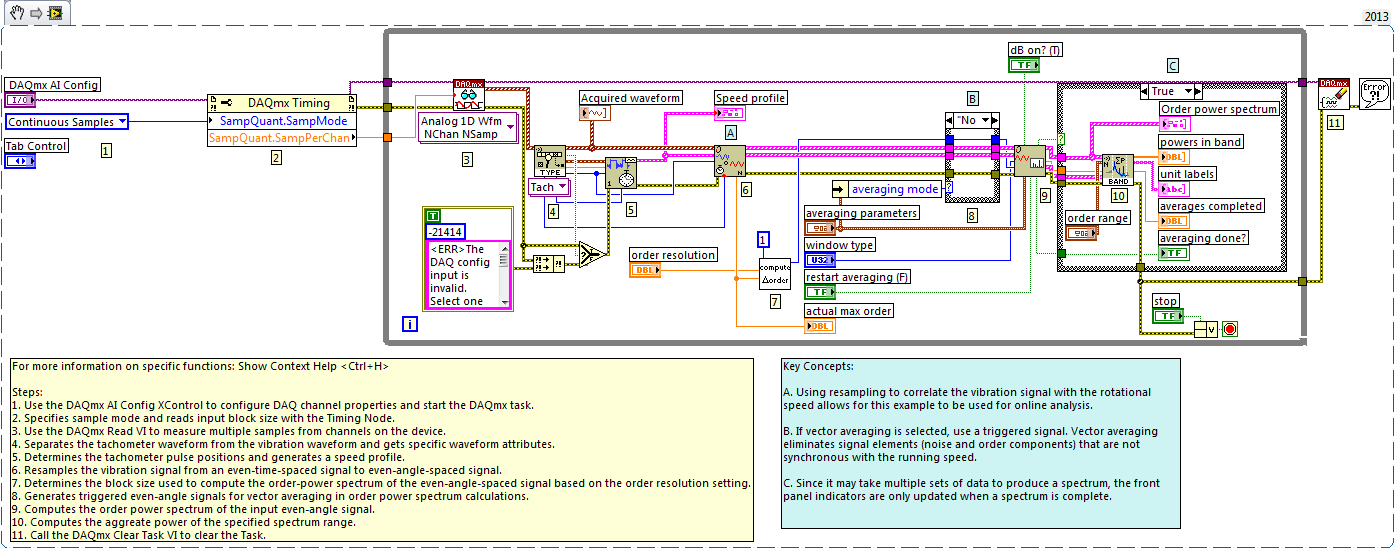
Instructions for running this VI:
- On the DAQ Configurations page on the front panel, specify the device and channel configurations, time settings, and tachometer channel information.
- On the Order Power Spectrum page on the front panel, specify the window type, block size or order resolution, and averaging parameters for power in band computation.
- Run the VI.
Order Analysis Function and Description List
Also see Sound and Vibration Software Overview and Feature Comparison to learn more about which Sound and Vibration distribution meets your needs.
- Tachometer Processing
- Order Power Spectrum
- Order Tracking
- Order Extraction
- Angular Resampling
- Waterfall Plot
- Orbit & Shaft Centerline Plot
- Polar & Bode Plots
- Envelope Detection
| Measurements | Features | Description |
| Display |
| Use the display VIs and indicators to configure and utilize the graphs and plots included to show acquired data and processed results. |
| Envelope Analysis | Envelope Detection | Use envelope detection analysis to identify mechanical faults that have an amplitude-modulating effect on the vibration signal of a machine. |
| Order Analysis |
| Use the Order Analysis VIs to calculate order-related results such as order map, order magnitude and phase, order spectrum, and order waveform. |
| Slow Roll Compensation | Slow-roll compensation | Use the OAT Get Vector Reference VI to extract the vector reference signal. Use the OAT Get Even Angle Reference VI to extract the even-angle reference signal from the slow-roll vibration and tachometer signal. Use the OAT Compensate Vector Signal VI to remove the slow-roll errors in the vector signal. Use the OAT Compensate Even Angle Signal VI to remove the slow-roll errors from the even-angle signal. |
| Tachometer Signal Processing | Analog and digital tachometer signal processing | Use the Tachometer Signal Processing VIs to process analog and digital tachometer signals. |