Parameterize Results File Series
- Updated2025-10-31
- 4 minute(s) read
For results file data series, the x and y variables for the two-dimensional representation are always parameterized first. Optionally, a z-variable can also be specified for the isometric representation.
Introduced in PAtools 7.2 upgrade 01/2019
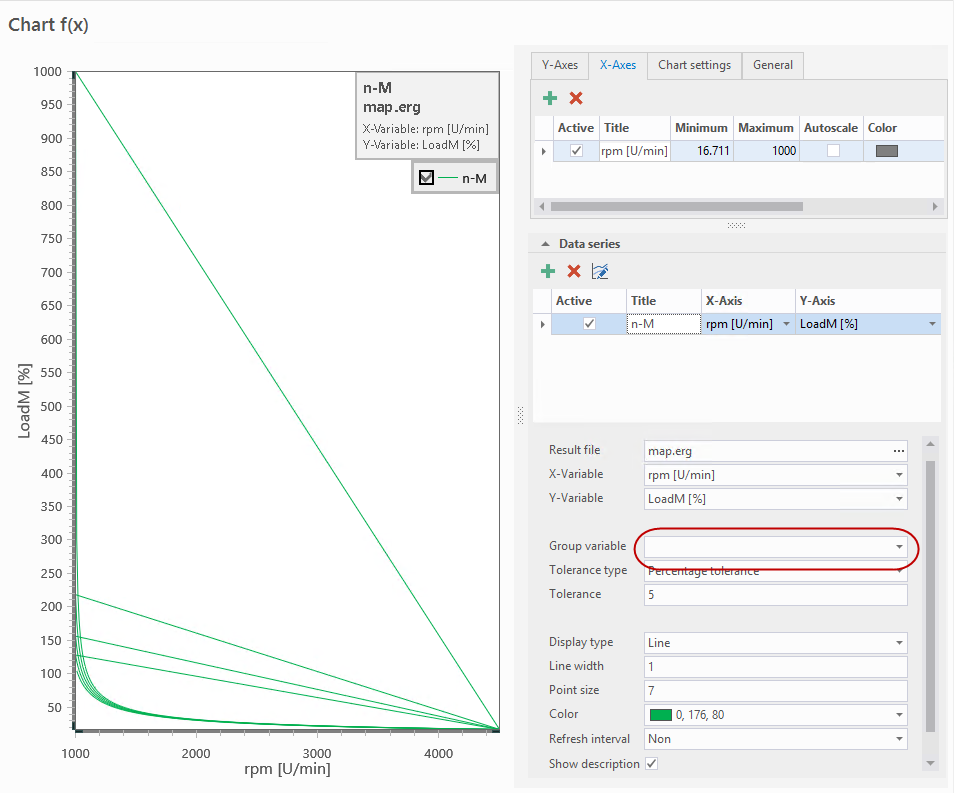
Parameterization 2D
For parameterizing a 2D results file data series, you must fill in all fields except Grouping variable. The fields for parameterizing the tolerance and display are already filled in with standard values. You need to define only the results file and select the variables for the x - and y-values. The file formats currently supported are PAtools results files in ASCII (.erg, .e*), binary format (.bin), and .xls or .xlsx files.

| Field | Entry | Description |
|---|---|---|
| Results file | Direct entry or file-open dialog | Results file that contains the variables to be displayed. File names and paths are specified relative to the results file of the current run-time system |
| X-Variable | Selection list variable | Variable to be displayed on the x-axis |
| Y-Variable | Selection list variable | Variable to be displayed on the y-axis |
| Grouping variable | Selection list variable | Variables whose value is used for grouping the y-variable. |
| Tolerance type | Selection list type | Interpretation of the tolerance as a percentage or absolute |
| Tolerance | Input floating-point number | Deviation from which the next y-value is assigned to a new group |
| Display type | Selection list type | Setting the display as points, line or points and line |
| Line width | Floating-point number | When selecting display type Line or Points and Line: line width in pixel. |
| Point size | Floating-point number | When selecting display type Line or Points and Line: point size in pixel. |
| Point limit | Integer | Maximum number of simultaneously displayed data points. |
| Color | Color selection | Color for drawing points or lines |
| Refresh interval | Selection list refresh | Determining whether the displayed file shall be refreshed faster, slower or not automatically. |
| Show description | Yes/No option | Defines whether a window is displayed in the chart that contains the name of the series, the name of the results file and the displayed variables (see below) |

Results File Structure
To import .xlsx or .xls files, the workbook must have the following structure:
- Each column corresponds to one PAtools variable.
- The first line acts as a header and contains the variable names (if necessary with unit in square brackets).
- The data starts from the second line.

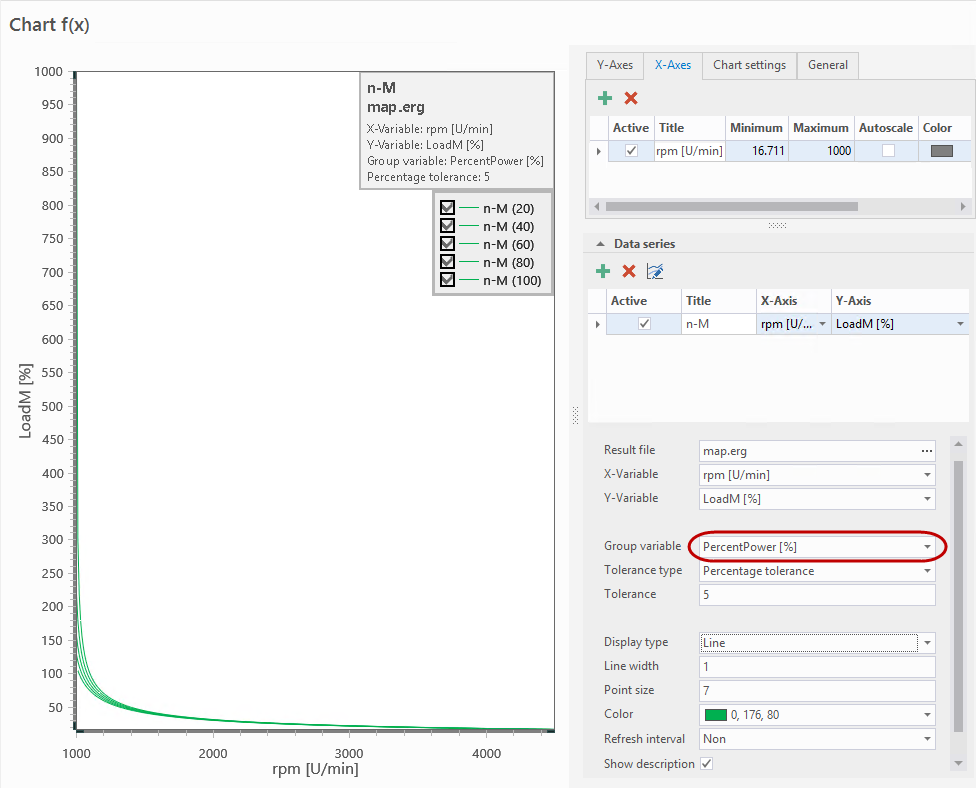
Grouping and Tolerance
A grouping size can be defined to represent maps with several characteristics in the same graphic. If this grouping variable changes its value, a new sub-series is created. All following x-y value pairs are assigned to this new sub-series. Because the grouping variable is usually measured and therefore their values are subject to certain inaccuracies, a tolerance can be defined within the value of the grouping variable is assumed as unchanged.
Consequences of the grouping:
- No connection lines between the values in the graphic are drawn when moving to the next series.
- In the legend an entry for each value of the grouping variable exists. The text of the entry is composed of the name of the data series and the value of the grouping variable.
- The description field contains additional information on the grouping variable and the tolerance.