TSA Periodogram (Array) VI
- Updated2024-07-30
- 4 minute(s) read
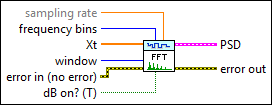
Computes the single-sided power spectral density (PSD) of a univariate time series using the periodogram method. The periodogram method is a fast Fourier transform (FFT) based method that estimates the PSD. Wire data to the Xt input to determine the polymorphic instance to use or manually select the instance.
Inputs/Outputs
 sampling rate
—
sampling rate
—
sampling rate specifies the sampling rate, in hertz, of the univariate time series Xt. The default is 1.  frequency bins
—
frequency bins
—
frequency bins specifies the number of frequency bins for which this VI computes the single-sided power spectral density PSD. The length of the single-sided PSD is (frequency bins/2+1). The default is 1024.  Xt
—
Xt
—
Xt specifies the univariate time series.  window
—
window
—
window specifies the time-domain window applied to the time series. Options include None (default), Hanning, Hamming, Blackman-Harris, Exact Blackman, Blackman, Flat Top, 4 Term B-Harris, 7 Term B-Harris, and Low Sidelobe.  error in (no error)
—
error in (no error)
—
error in describes error conditions that occur before this node runs. This input provides standard error in functionality.  dB on? (T)
—
dB on? (T)
—
dB on? specifies whether this VI returns the PSD in decibels or in a linear scale. If dB on? is TRUE, this VI returns the PSD in decibels. If dB on? is FALSE, this VI returns the PSD in a linear scale. The default is TRUE.  PSD
—
PSD
—
PSD returns information about the single-sided power spectral density (PSD).
 error out
—
error out
—
error out contains error information. This output provides standard error out functionality. |
 f0
—
f0
—
 S(f)
—
S(f)
—
TSA Periodogram Details
This VI computes the PSD of a time series using the periodogram method according to the following equation:

where S(f) is the PSD of the time series. df is the frequency interval, which is computed as fs/N. NBW is the noise power bandwidth of the window. N is the number of frequency bins. fs is the sampling rate. Before computing the PSD, this VI wraps the original time series Xt to an N-point series Xt'.
Examples
Refer to the following VIs for examples of using the TSA Periodogram VI:
- Average PSD VI: labview\examples\Time Series Analysis\TSAGettingStarted
- Beam Crack Detection VI: labview\examples\Time Series Analysis\TSAApplications
- Power Spectral Density Estimation VI: labview\examples\Time Series Analysis\TSAGettingStarted