TSA AR Spectrum VI
- Updated2024-07-30
- 2 minute(s) read
Computes the single-sided power spectral density (PSD) of a univariate time series based on autoregressive (AR) modeling. The PSD computed with this method is exempt from window effects and has a better frequency resolution than the results from using the periodogram method.

TSA AR Spectrum Details
This VI computes the single-sided PSD of a univariate time series based on AR modeling according to the following equation:
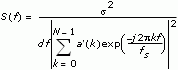
where S(f) is the PSD of the time series. df is the frequency interval, which is computed as fs/N. N is the number of frequency bins, fs is the sampling rate, and s² is the noise variance of the estimated AR model of the time series. a is an array that contains the coefficients of the AR model. a=[1, a1, a2,… ,an], where n is AR order. Before computing the PSD, this VI wraps a to N-point series a'.
The minimum length requirement for the input time series needs to be at least two times the AR order.
Examples
Refer to the Power Spectral Density Estimation VI in the labview\examples\Time Series Analysis\TSAGettingStarted directory for an example of using the TSA AR Spectrum VI.