TFA Adaptive Spectrogram (Complex) VI
- Updated2025-12-08
- 5 minute(s) read
Decomposes the signal into a linear combination of Gaussian chirplet elementary functions and sums the Wigner-Ville Distribution (WVD) of all the Gaussian chirplet elementary functions to compute the quadratic time-frequency representation of signal. Use this VI if the signal contains Gaussian chirps. Wire data to the signal input to determine the polymorphic instance to use or manually select the instance.
Inputs/Outputs
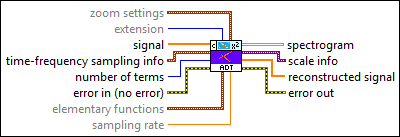
 zoom settings
—
zoom settings
—
zoom settings specifies the frequency zoom factor and the zoom range.
 extension
—
extension
—
extension specifies the method to use to pad data at the borders of the input signal to lessen discontinuity. The extension length is half the window length.  signal
—
signal
—
signal specifies the input signal.
time-frequency sampling info
—
time-frequency sampling info specifies the density to use to sample the signal in the joint time-frequency domain and defines the size of the resulting 2D time-frequency array.
 number of terms
—
number of terms
—
number of terms specifies the maximum number of elementary functions to use in the adaptive representation.  error in (no error)
—
error in (no error)
—
error in describes error conditions that occur before this node runs. This input provides standard error in functionality.
elementary functions
—
elementary functions specifies the settings of the elementary functions.
 sampling rate
—
sampling rate
—
sampling rate specifies the sampling rate of signal in hertz. sampling rate must be greater than 0, or this VI sets sampling rate to 1 automatically. The default is 1.  spectrogram
—
spectrogram
—
spectrogram returns the quadratic time-frequency representation of the signal. Each row corresponds to the instantaneous power spectrum at a certain time.  scale info
—
scale info
—
scale info returns the time scale and the frequency scale information of the time-frequency representation, including the time offset, the time interval between every two contiguous rows, the frequency offset, and the frequency interval between every two contiguous columns of spectrogram. Use the TFA Get Time and Freq Scale Info VI to return detailed information about the time scale and the frequency scale.  reconstructed signal
—
reconstructed signal
—
reconstructed signal returns the signal reconstructed from the specified elementary functions.  error out
—
error out
—
error out contains error information. This output provides standard error out functionality. |
TFA Adaptive Spectrogram Details
You can combine a series of Gaussian chirplets to approximate a signal, s(t). The adaptive spectrogram is the summation of the weighted WVD of each Gaussian chirplet. The adaptive spectrogram does not contain cross-term interference. Because the WVD of the Gaussian function is nonnegative, the adaptive spectrogram is also nonnegative. Use the adaptive spectrogram if a set of Gaussian chirplets can represent the signal.