Visually Inspecting the Data (Advanced Signal Processing Toolkit or Control Design and Simulation Module)
- Updated2023-03-14
- 2 minute(s) read
Various unexpected events, such as an abnormal pulse, a temporary sensor failure, or a transmitter failure can corrupt the raw data samples. These disturbances can result in outliers, clipped saturation, and/or quantization effects that severely distort the resulting model estimation. Visually inspecting the data is the best way to detect these disturbances.
In the following figure, you can recognize outliers by visually inspecting the data.
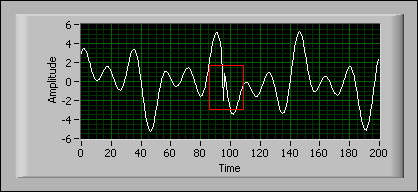
In the previous figure, notice that the data acquired between 85–100 seconds is abnormal. When preprocessing data, you want to remove all outliers in the data set. You must remove the outliers manually.
 |
Note You also can plot the data waveform and the spectral density function of the data to discover periodic disturbances. |
Traditionally, you examine data samples either in the time domain or the frequency domain. An effective approach is to display the data in the joint time-frequency domain, which provides a better understanding about the measured signals. You must have the LabVIEW Advanced Signal Processing Toolkit installed to use the joint time-frequency domain.