Projection Properties
- Updated2025-07-30
- 3 minute(s) read
Adjusts the types of projections associated with the plot.
The plot can be projected onto the xy plane, xz plane, or yz plane.
Inputs/Outputs
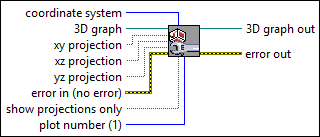
 coordinate system
—
coordinate system
—
coordinate system can be cwCartesian, cwCylindrical, or cwSpherical. The default is cwCartesian.  3D graph
—
3D graph
—
3D graph accepts the reference to the 3D control.  xy projection
—
xy projection
—
xy projection projects an image of the plot onto the xy plane.
xz projection
—
xz projection projects an image of the plot onto the xz plane.
yz projection
—
yz projection projects an image of the plot onto the yz plane.  error in (no error)
—
error in (no error)
—
error in describes error conditions that occur before this node runs. This input provides standard error in functionality.
show projections only
—
show projections only allows only the projections to be shown.
plot number (1)
—
plot number is the index into the list of plots from the properties of the 3D control. Add new plots by right-clicking the control and adjusting the properties. The default is the first plot from the list.  3D graph out
—
3D graph out
—
3D graph out passes the reference to the 3D control out so that you can use it with other VIs.  error out
—
error out
—
error out contains error information. This output provides standard error out functionality. |