3D Parametric Surface
- Updated2025-07-30
- 3 minute(s) read
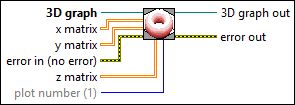
Plots a surface in terms of x, y, and z surfaces. The VI has three 2D array or matrix inputs that specify each of the x, y, and z planes.
Inputs/Outputs
 3D graph
—
3D graph
—
3D graph accepts the reference to the 3D control.  x matrix
—
x matrix
—
x matrix is a 2D array of data that determines the surface in relation to the x plane.
y matrix
—
y matrix is a 2D array of data that determines the surface in relation to the y plane.  error in (no error)
—
error in (no error)
—
error in describes error conditions that occur before this node runs. This input provides standard error in functionality.
z matrix
—
z matrix is a 2D array of data that determines the surface in relation to the z plane. The x and y vectors shift or skew the set of data in the z matrix.  plot number (1)
—
plot number (1)
—
plot number is the index into the list of plots from the properties of the 3D control. Add new plots by right-clicking the control and adjusting the properties. The default is the first plot from the list.  3D graph out
—
3D graph out
—
3D graph out passes the reference to the 3D control out so that you can use it with other VIs.  error out
—
error out
—
error out contains error information. This output provides standard error out functionality. |