Radar Plot VI
- Updated2025-07-30
- 6 minute(s) read
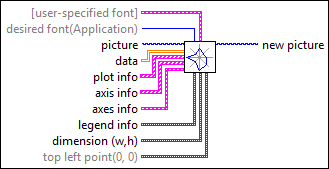
Takes a picture and an array of plots and appends a picture that represents the radar plot of the data.
You can use a radar plot to compare the performance of one set of data with another set of data. This VI uses the Draw Legend VI as a subVI.
Inputs/Outputs
 [user-specified font]
—
[user-specified font]
—
[user-specified font] specifies the specific font characteristics for the text to draw. The VI ignores this input unless desired font is User-specified Font.
 desired font(Application)
—
desired font(Application)
—
desired font specifies the text font.
 picture
—
picture
—
picture is the picture to which you want to add the plot. The default is an empty picture.  data
—
data
—
data is a 2D array, where each row represents a plot. The VI draws each index in a plot on a corresponding y-scale. A straight line connects all the points in a plot.  plot info
—
plot info
—
plot info specifies the name, color, and fill option for each plot. The index of this array matches the row index in data. The VI uses plot name and plot color for the legend.
axis info
—
axis info specifies the label (name) of each y-axis and the minimum and maximum value of each y-axis. The index of this array matches the column index in data.
axes info
—
axes info specifies the color, format and precision of the y-axes, and whether to autoscale the y-axes.
 legend info
—
legend info
—
legend info specifies the location of the plot legend relative to the radar plot.
dimension (w,h)
—
dimension (w,h) specifies the rectangle in coordinates into which the VI draws the radar plot and legend.
top left point(0, 0)
—
top left point specifies in coordinates where to place the top-left corner of the image in the new picture.
 new picture
—
new picture
—
new picture is the picture that contains the plot. You can wire this output to any other picture input to add more drawing instructions to the picture. You also can wire this output to the Picture to Pixmap VI to obtain an image data cluster. You then can save the image data to a file using the Graphics Formats VIs. |
 Font Name:
—
Font Name:
—
 Size
—
Size
—
 Strikeout?
—
Strikeout?
—
 plot color (white)
—
plot color (white)
—
 max value
—
max value
—
 precision
—
precision
—
Examples
Refer to the following example files included with LabVIEW.
- labview\examples\Graphics and Sound\Picture Plots\Simple Radar Plot.vi