Amplitude and Levels N chan VI
- Updated2025-07-30
- 3 minute(s) read
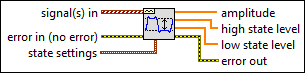
Returns the amplitude, high state level, and low state level of a waveform or an array of waveforms. Wire data to the signal in input to determine the polymorphic instance to use or manually select the instance.
Inputs/Outputs
 signal(s) in
—
signal(s) in
—
signal(s) in is an array of waveforms containing the signals to measure.  error in (no error)
—
error in (no error)
—
error in describes error conditions that occur before this node runs. This input provides standard error in functionality.  state settings
—
state settings
—
state settings specifies the method used to determine the high and low state levels of a waveform. For pulse and transition waveform measurements, state levels provide a means to identify the position in time of the waveform feature to be measured.
 amplitude
—
amplitude
—
amplitude is an array containing the amplitude of each waveform in signal(s) in.
high state level
—
high state level is an array containing the high state level of each waveform in signal(s) in.
low state level
—
low state level is an array containing the low state level of each waveform in signal(s) in.  error out
—
error out
—
error out contains error information. This output provides standard error out functionality. |
 method
—
method
—
 histogram size
—
histogram size
—
 reserved
—
reserved
—
The terminology and measurement definitions for this VI comply with IEEE Standard 181-2003, IEEE Standard on Transitions, Pulses, and Related Waveforms.
Examples
Refer to the following example files included with LabVIEW.
- labview\examples\Signal Processing\Waveform Measurements\N channel Pulse and Transition Measurements.vi