Computes the coefficients that best represent the input data based on the chosen model type.


icon

Dialog Box Options

Option Description
Model Type Displays the data and results according to a mathematical model type you specify.

The model type can be any of the following options:

  • Linear

    Finds the slope and intercept of the line that best represents the input data set in the least-squares sense.

  • Quadratic

    Finds the polynomial curve of order 2 that best represents the input data set in the least-squares sense.

  • Spline

    Returns the spline interpolant of length n.

    n contains the second derivatives of the spline interpolating function g(x) at the tabulated points ξ, where i = 0, 1, …, n – 1.

  • Polynomial

    Finds the set of polynomial fit coefficients that best represents the input data set in the least-squares sense.

    • Polynomial order

      Must be greater than or equal to zero. If Polynomial order is less than zero, the Express VI returns an error. The default is 5. This option is available only when you select the Polynomial option.

      The value of polynomial order must observe the following relationship: 0 ≤ m < n – 1, where n is the number of sample points, and m is Polynomial order.

  • General least squares linear

    Finds the k-dimension linear curve values and the set of k-dimension linear fit coefficients that best represents the input data set using the least-squares solution.

    • Models

      Individual functions of the independent variable. This option is available only when you select the General least squares linear option.

      In the following equation, the models are the functions of x, namely f0(x), f1(x), …, fn – 1(x). where a = {a0, a1, a2, …, an – 1}

  • Current Model

    Displays the formula for the currently selected Model Type. This display is available only when you set Model Type to Linear, Quadratic, Spline, Polynomial, or General least squares linear.

  • Non-linear

    Uses the Levenberg-Marquardt algorithm to determine the set of coefficients of the nonlinear model that best represents the input data set in the least-squares sense. The nonlinear model is expressed by a nonlinear function y = f(x,a), where a is the set of coefficients.

    • Independent variable

      Specifies the independent variable in Non-linear model. This option is available only when you select the Non-linear option.

    • Maximum iterations

      Maximum number of executing iterations. If the Express VI reaches Maximum iterations without finding a solution, the VI returns an error. You must increase Maximum iterations or adjust Initial guesses to find a solution. The default is 500. This option is available only when you select the Non-linear option.

    • Initial guesses

      Initial guesses of the solution coefficients. This option is available only when you select the Non-linear option.

  • Non-linear model

    String that describes the model equation. This option is available only when you select the Non-linear option.

results

Displays values generated for the parameters based on the options you select and values you enter.

Data Graph

Displays the original data and the best fit.

The VI calculates best fit using the following equation. zi = f(xi)A where A is the best fit coefficient.

Residue Graph

Displays the difference between the original data and the best fit.

Inputs/Outputs

  • cerrcodeclst.png error in (no error)

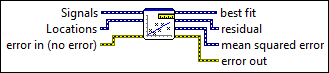
    Describes error conditions that occur before this node runs.

  • cexpdynwdt.png Signals

    Specifies the observed values of the dependent variable.

  • cexpdynwdt.png Locations

    Specifies the values of the independent variables.

  • iexpdynwdt.png best fit

    Returns the fitted data.

    The VI calculates best fit using the following equation. zi = f(xi)A where A is the best fit coefficient.

  • iexpdynwdt.png slope

    Returns the slope of the calculated best linear fit.

  • iexpdynwdt.png a0

    Returns the constant term of the calculated best quadratic fit.

  • iexpdynwdt.png a2

    Returns the coefficient of the second-order term.

  • iexpdynwdt.png spline interpolant

    Returns the second derivative of interpolating function g(x).

    spline interpolant is the second derivative of interpolating function g(x) at points ξ, i = 0, 1,…, n – 1.

  • iexpdynwdt.png non-linear coefficients

    Returns the set of coefficients of the nonlinear model that best represents the input data set in the least-squares sense.

  • iexpdynwdt.png mean squared error

    Returns the mean square error of the best fit.

  • iexpdynwdt.png intercept

    Returns the intercept of the calculated best linear fit.

  • iexpdynwdt.png polynomial coefficients

    Returns the coefficients that describe the best polynomial fit. The total number of elements in polynomial coefficients is m + 1, where m is Polynomial order.

  • ierrcodeclst.png error out

    Contains error information. This output provides standard error out functionality.

  • iexpdynwdt.png a1

    Returns the coefficient of the first-order term.

  • iexpdynwdt.png general LS coefficients

    Returns the set of coefficients that best represent the input data set in the least-squares sense.

  • iexpdynwdt.png residual

    Returns the difference between the original data and the best fit.