Correlation Methods (Advanced Signal Processing Toolkit)
- Updated2023-02-21
- 4 minute(s) read
Correlation measures the similarity between two signals. The correlation methods include auto-correlation and cross-correlation.
Auto-Correlation
Auto-correlation is the correlation of a time series with itself. You can use the auto-correlation method to capture periodic components in a univariate time series without other reference time series. The auto-correlation operation preserves the frequency and amplitude information of periodic components but does not preserve the phase information.
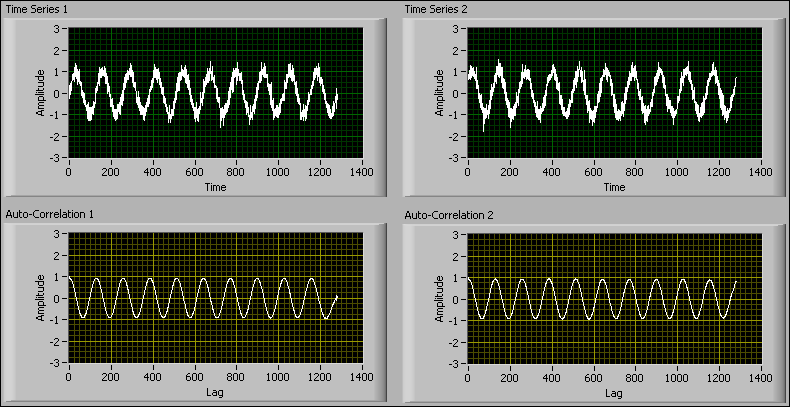
The following figure shows two noise-contaminated, phase-jittered time series and the resulting auto-correlation plots. In the Auto-Correlation 1 and Auto-Correlation 2 graphs, you can see that auto-correlation greatly attenuates the noise in the original time series, thereby potentially improving the accuracy and reliability of subsequent frequency or periodicity estimates calculated for the time series.

As the previous figure shows, though the time series in the Time Series 1 and Time Series 2 have a difference in phase, the auto-correlations are close to each other. Therefore, auto-correlation does not preserve the phase information, which can be a beneficial property in applications such as feature extraction.
When performing auto-correlation of a time series, you can choose either biased or unbiased weighting. Biased weighting is helpful when you perform spectral analysis with the Fourier transform, because biased weighting can reduce spectral leakage, bias, and variance in the resulting power spectrum. Unbiased weighting is suitable for periodicity detection in the time domain. If you use unbiased weighting, the amplitudes of the auto-correlation values do not decrease as the lag increases.
The following figure shows a time series of a sinusoidal pattern.

The following figure shows the estimated biased and unbiased auto-correlation of the sinusoidal pattern, respectively.

Use the TSA Auto-Correlation Function VI to perform auto-correlation operations on a univariate time series.
You also can perform partial auto-correlation on a time series using the TSA Auto-Correlation Function VI. Partial auto-correlation is useful for estimating the autoregressive (AR) model order of a time series.
Cross-Correlation
Cross-correlation measures the similarity between two time series. You can find the features of an unknown time series by computing the cross-correlation between the unknown time series and a known time series. For example, if you know the frequency of a sinusoid time series but do not know the amplitude and phase, you can derive the amplitude and phase of the time series with the cross-correlations. The following figure shows the flowchart of obtaining the magnitude response and phase response of a physical system with the cross-correlation method.

In this flowchart, a sinusoid stimulus signal x(t) = sin(ω0t) at a specified frequency ω0 is applied to the physical system. The system then generates the response signal y(t) = A(ω0)sin(ω0t + φ(ω0)). A(ω0) and φ(ω0) define the magnitude response and phase response of the physical system at ω0, respectively. The term 1/2Asin(φ0) is obtained by performing cross-correlation between the stimulus signal x(t) and the response signal y(t) at τ = 0, where τ denotes the lag. The term 1/2Acos(ω0) is obtained by performing cross-correlation between the phase-delayed stimulus signal x(t) = cos(ω0t) and the response signal y(t) at τ = 0. You can obtain the magnitude response A(ω0) from the square root of (1/2Asin(φ0))2 + (1/2Acos(φ0))2. You can obtain the phase response φ(ω0) from the inverse tangent of the quotient of 1/2Asin(φ0) divided by 1/2Acos(φ0). If you change the frequency of the stimulus signal, you can obtain the response of the system at other frequencies.
Use the TSA Cross-Correlation Function VI to perform cross-correlation on two time series.