Interactively Testing Plug-Ins
- Updated2025-11-25
- 3 minute(s) read
When plug-ins load and run in FlexLogger, the application’s compiled data engine and the compiled plug-ins prevent interactive debugging with LabVIEW. The Plug-in Environment Simulator provides a simplified, test-specific environment that allows developers to run and debug plug-ins from the source G code.
The Plug-in Environment Simulator installs to %ProgramFiles%\National Instruments\LabVIEW <version>\resource\FlexLogger\SDK\Plugin Environment Simulator.
To enable interactive debugging of plug-in source code, the Simulator is provided as a VI as shown in the following figure.

To debug a plug-in, open and run the Plugin Environment Simulator VI. When the simulator starts running, it prompts you for the plug-in class to debug. The following figure displays the simulator running an unmodified Produce Data for FlexLogger plug-in.
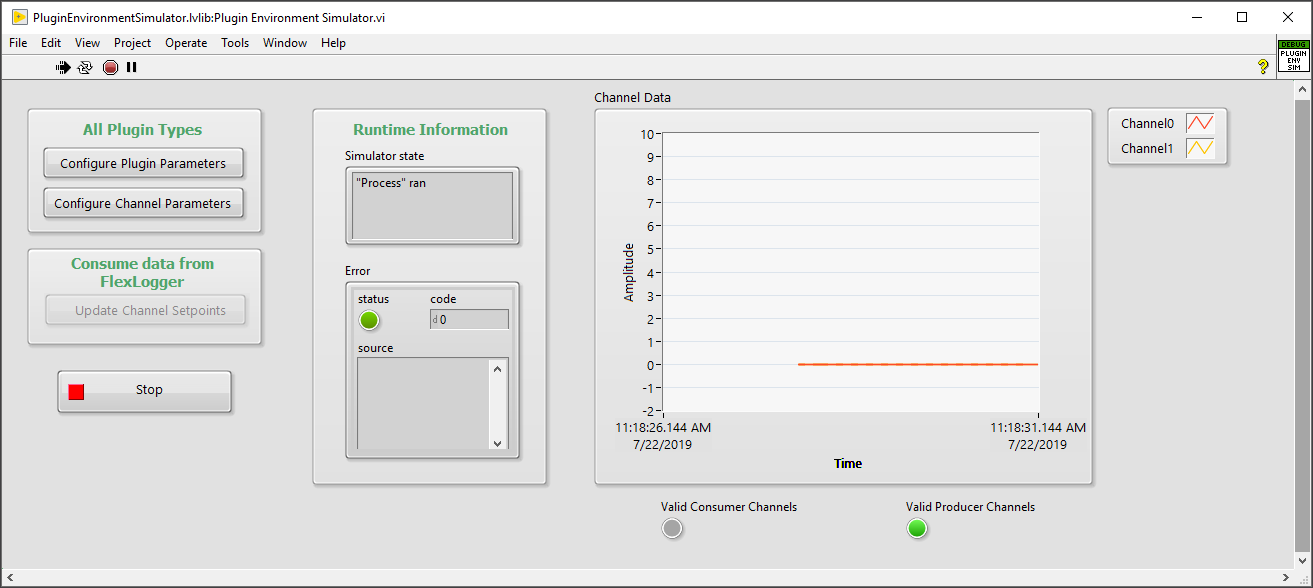
The Configure Plugin Parameters button allows you to update plug-in parameters.

Similarly, the Configure Channel Parameters allows developers to update channel parameters.

Plug-ins following the consume setpoint data template do not write any data to FlexLogger, so the Channel Data chart shows the current setpoint values. The Update Setpoint Channels button provides the input information needed to write the correct values to an external system. The following figure shows setting the setpoint for an unmodified setpoint consumer plug-in example.

When using waveform channel inputs with the simulator, it is first necessary to pick channel(s) that are mapped to the parameters. This mimics the behavior when interacting with the application. In the simulator, any designated name receives a constant value waveform. Configure mapped channels through the Configure Device Parameters dialog as shown in the following figures.


You can change the constant value using the Change Setpoint option.
