Single-Shot
- Updated2023-02-17
- 5 minute(s) read
Single-Shot
Finds the discrete histogram of a signal.

Inputs/Outputs

output representation
Representation for the output.
| sample count |
Represents the value of each bin as the number of samples in that bin. |
| percent of total |
Represents the value of each bin as a percentage of the total. |
Default value: sample count

signal
The input signal.
This input supports the following data types:
- Waveform
- Array of waveforms
- 1D array of double-precision, floating-point numbers
- 2D array of double-precision, floating-point numbers

number of bins
Number of bins in the histogram.
Default value: 10

maximum
Maximum value to include in the histogram.
Default value: 0
minimum
Minimum value to include in the histogram.
Default value: 0

error in
Error conditions that occur before this node runs.
The node responds to this input according to standard error behavior.
Default value: No error
inclusion
The boundary of each bin to handle.
| lower |
Includes the lower boundary. |
| upper |
Includes the upper boundary. |
Default value: lower
Determining the Bin Widths When inclusion Is lower
If inclusion is set to lower, the bin widths are determined according to the following equations.
where
- max is the maximum
- min is the minimum
- m is the number of bins
Determining the Bin Widths When inclusion Is upper
If inclusion is set to upper, the bin widths are determined according to the following equations.
where
- max is the maximum
- min is the minimum
- m is the number of bins

histogram
The histogram of the input signal.
This input accepts a cluster or a 1D array of clusters.

x values
An array of the center values of the bins of the histogram.
histogram h(x)
Discrete histogram of the input signal.

actual number of bins
Actual number of bins in the histogram.
This output can return a 32-bit signed integer number or a 1D array of 32-bit signed integer numbers.

actual maximum
Actual maximum value in the histogram.
This output can return a double-precision, floating-point number or a 1D array of double-precision, floating-point numbers.
actual minimum
Actual minimum value to include in the histogram.
This output can return a double-precision, floating-point number or a 1D array of double-precision, floating-point numbers.

error out
Error information.
The node produces this output according to standard error behavior.

samples outside
Information about points that do not fall in any bin upon successful execution of the node.
total
Total number of values in signal that do not fall in any bin upon successful execution.
below
Number of values in signal below the first bin on the lower boundary.
above
Number of values in signal above the last bin on the upper boundary.
Examples
The following illustration shows the waveform of an input signal.
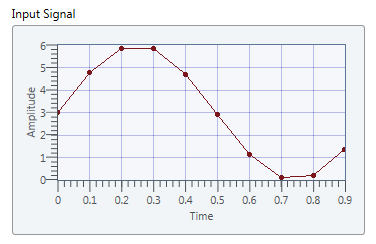
This example configures the node using the following input values:
- maximum = 6
- minimum = 0
- number of bins = 3
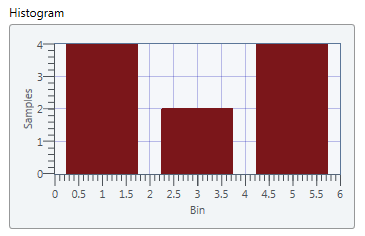
Algorithm for Constructing histogram
The histogram is a frequency count of the number of times that a specified frequency bin occurs in the input sequence. The node constructs histogram as follows.
The following equation calculates the width of the frequency bin Δx.
where max is the maximum, min is the minimum, and m is the number of bins.
The node calculates the center of each frequency bin according to the following equation.
The node defines the range of the ith frequency bin according to the following definition.
for i = 0, 1, 2, ..., m - 1
The node scans the input sequence, calculates the number of samples in each frequency bin from 0 to m - 1, and returns the histogram.