From 04:00 PM CDT – 08:00 PM CDT (09:00 PM UTC – 01:00 AM UTC) Tuesday, April 16, ni.com will undergo system upgrades that may result in temporary service interruption.
We appreciate your patience as we improve our online experience.
From 04:00 PM CDT – 08:00 PM CDT (09:00 PM UTC – 01:00 AM UTC) Tuesday, April 16, ni.com will undergo system upgrades that may result in temporary service interruption.
We appreciate your patience as we improve our online experience.
Due primarily to its widespread availability, Microsoft Excel is often the de facto choice of engineers and scientists in need of software for measurement data analysis and manipulation. Microsoft Excel lends itself well to extremely simple test and measurement applications and the financial uses for which it was designed; however, in an era when companies are forced to do more with less, choosing the appropriate tools to maximize efficiency (thereby reducing costs) is imperative. Just because Microsoft Excel is already installed on your computer does not make it the right tool for every job.
National Instruments’ DIAdem software – which was specifically created for the management, inspection, analysis, and reporting of acquired or simulated engineering and scientific data – offers efficiency gains and scalability with features that overcome the limitations of Excel in most data post-processing applications.
Microsoft Excel uses the cell as its fundamental building block. Cells form rows and columns to make up a spreadsheet, an architecture that is ideal for budgets and balance sheets. Simple, single-point data acquisition applications – for example, those that collect one single data point an hour over the course of a day – are often easily mapped to this architecture because each individual data point holds more importance when fewer data points are collected. Each data point exists as a cell in a spreadsheet and must be manipulated using Excel’s cell-based paradigm.
Most data acquisition applications, however, are not this trivial. Applications collecting dozens of data channels at mega sample-per-second (MS/s) rates are commonplace. In these applications, data manipulation and interaction is done on a signal – or channel – as a whole. When manipulating channels in Excel as columns of individual cells, the unity of a signal is lost. Though entire Excel columns can be manipulated at a time, this is more cumbersome with longer columns. Also, columns often contain descriptive information such as a name or unit in addition to the raw numeric data. In this case, a subset of the column must be selected (for example, the range A2:A99), introducing overhead and the potential for inaccuracy or errors.
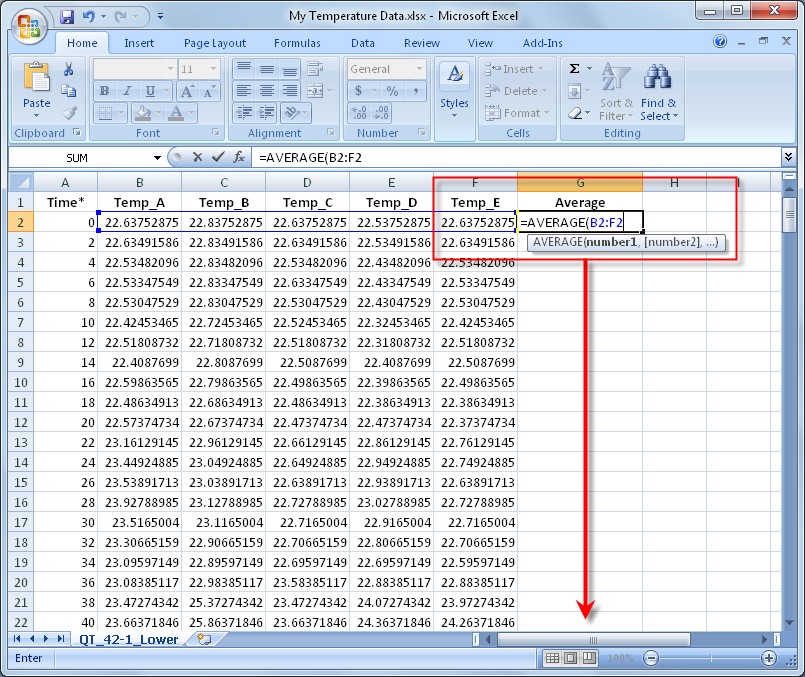
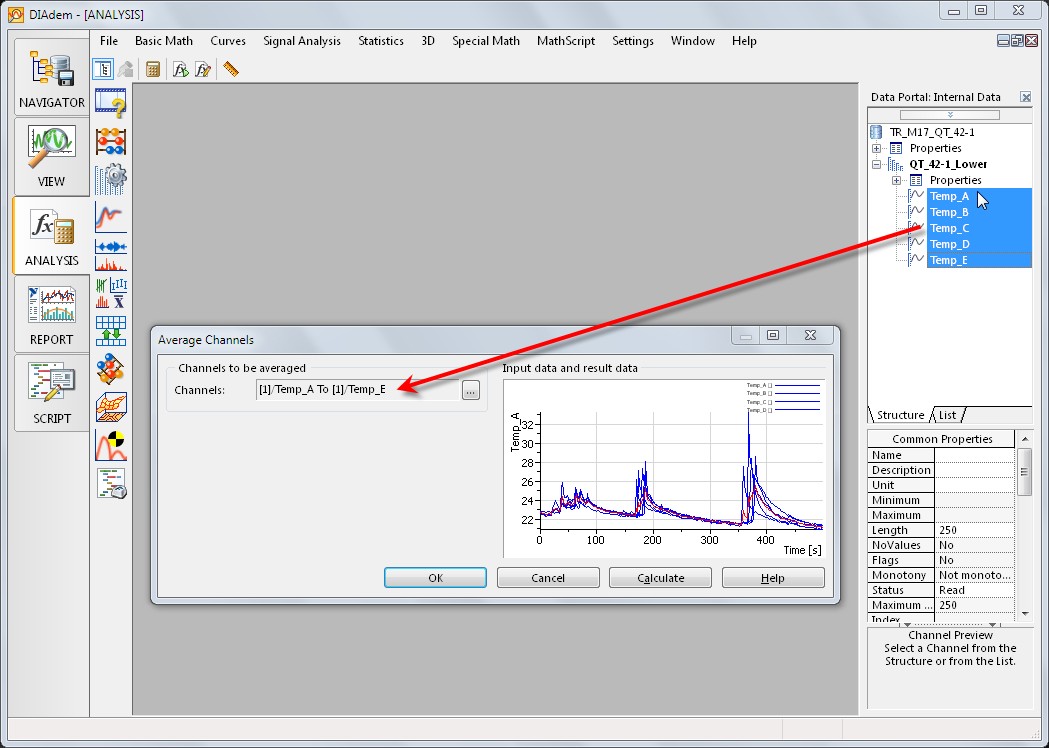
In Figure 1, Excel is used to perform a simple but common engineering task: averaging five [temperature] channels stored in columns to create a resultant Average channel. The averaging calculation must first be done with the building block of a cell, and then copied (or filled) to all cells in the resultant column. Using DIAdem, which uses the channel as its fundamental building block, averaging channels is as simple as dragging-and-dropping input channels to the Average Channels function, as shown in Figure 2. Individual data points can still be manipulated in DIAdem when necessary.
Figure 1. Microsoft Excel uses the cell as its fundamental building block. Even simple data analysis must be applied to a cell and then repeated for all cells in a column (channel).
Figure 2. NI DIAdem operates with the building block of a channel. Averaging is as simple as dragging-and-dropping entire data channels instead of unnecessarily manipulating individual data points.
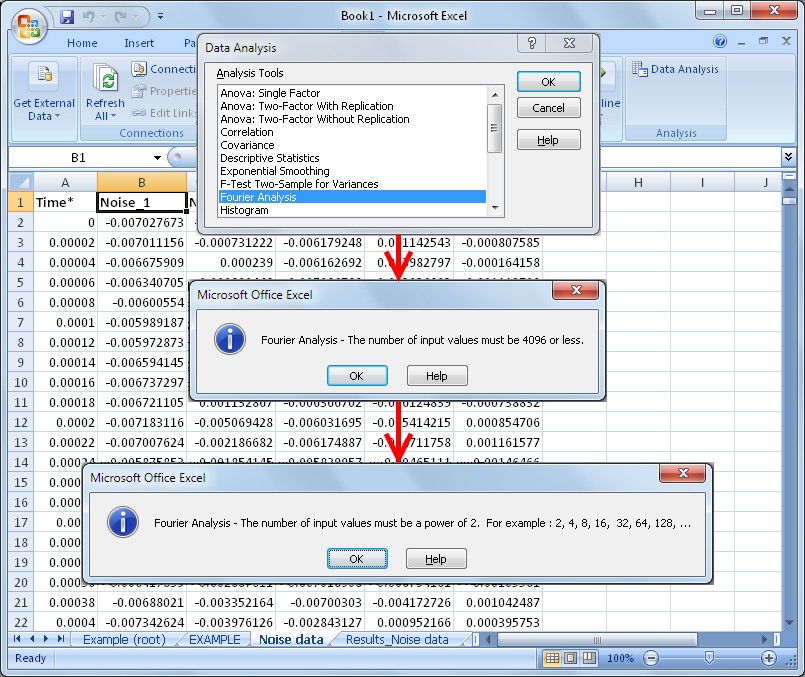
While the number of available formulas for finance-oriented calculations in Excel is extensive, you must configure an optional add-in called the Analysis Toolpak for access to a few engineering and statistical calculations. The Analysis Toolpak functions are extremely limited, as shown in Figure 3 with the common engineering calculation Fast Fourier Transform (FFT). In general, Excel’s analysis capabilities often do not meet the requirements of scientific or engineering applications. For further extensibility, Excel provides a robust Visual Basic for Applications (VBA) engine and an excellent VBA editing environment that enable you to write your own engineering calculations from scratch when Excel’s built in functions are insufficient for your application.
Figure 3. Microsoft Excel provides an exhaustive set of finance-based calculations and allows engineers to write their own code to meet their application needs.
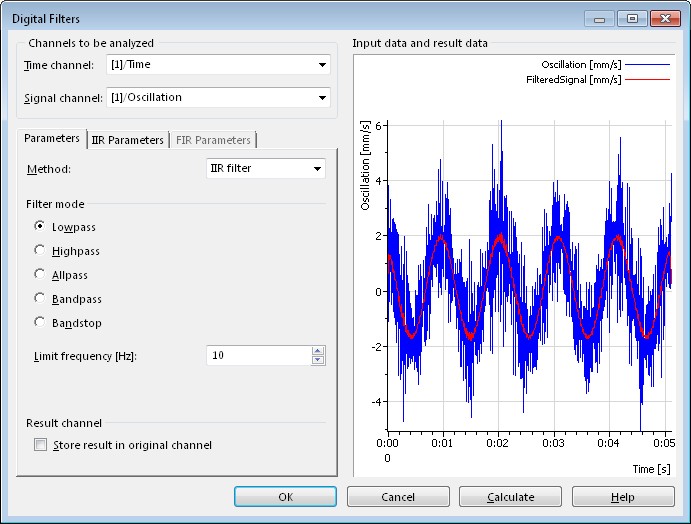
In DIAdem, hundreds of engineering and scientific analysis calculations – from simple addition to complex matrix manipulation and order analysis – have been included in the environment. The analysis functions in DIAdem are configuration-based; no programming is required to run even complex analysis such as Digital Filtering, as shown in Figure 4. Additionally, DIAdem analysis functions include full previews of analysis results so that you can avoid erroneous calculations by ensuring that you’re using the correct parameters prior to running each calculation.
Figure 4. DIAdem includes hundreds of analysis functions specific to scientists and engineers. Each calculation is configuration-based and provides a preview of resultant channels so that you can interact with parameters to ensure accuracy and reduce errors.
DIAdem also includes a framework for creating your own domain-specific calculations called the Calculation Manager, and it includes an integrated Visual Basic scripting interface for sequencing built-in DIAdem calculations or defining your own custom calculations.
Data streaming speeds of common applications reach or exceed MS/s rates. In an application that collects one single channel of data at 1 MS/s, a total of 1,000,000 data points will be collected in a one second acquisition. In a matter of minutes, billions of data points can be saved to gigabytes of hard drive space.
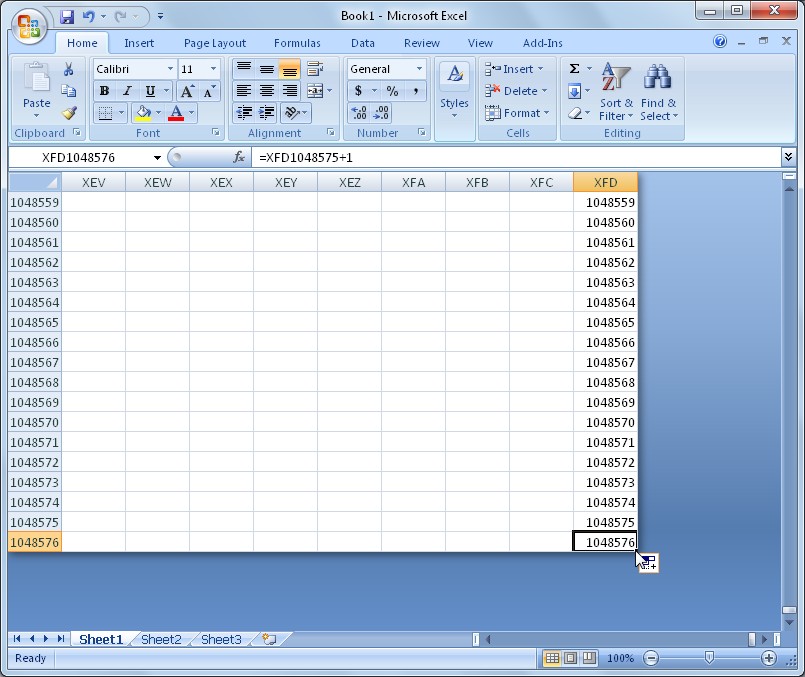
When Microsoft Excel attempts to load a data file containing a large volume of data, it attempts to load every single data point into memory. With the release of the 64-bit version of Microsoft Excel 2010, this is less of a limitation, as the application has a larger addressable memory space; however, loading the entirety of a large data set into Excel can often take many minutes due to the sheer volume of data that needs to be loaded. Furthermore, Excel stores not just numerical values in each cell but also numeric formatting, cell formatting, formulas, spreadsheet links, Internet hyperlinks, and comments. This cell-centric flexibility is ideal for business spreadsheets where cell-level visibility is key, but it adds unnecessary memory overhead for data sets with millions of values. To avoid potential memory problems, Excel imposes a limit on the maximum number of rows and columns. The introduction of Excel 2007 increased the total number of rows per worksheet from 65,536 to just over 1,000,000 (220, to be precise) and the total number of columns from 256 to 16,384 (214). Using Figures 5 and 6, contrast Excel's row and column limitation with DIAdem's ability to manipulate 500,000,000 rows (points) as only a fraction of its limitation.
Figure 5. Excel can only load just over 1 million rows of data for any given column. This is a limitation for scientists and engineers.
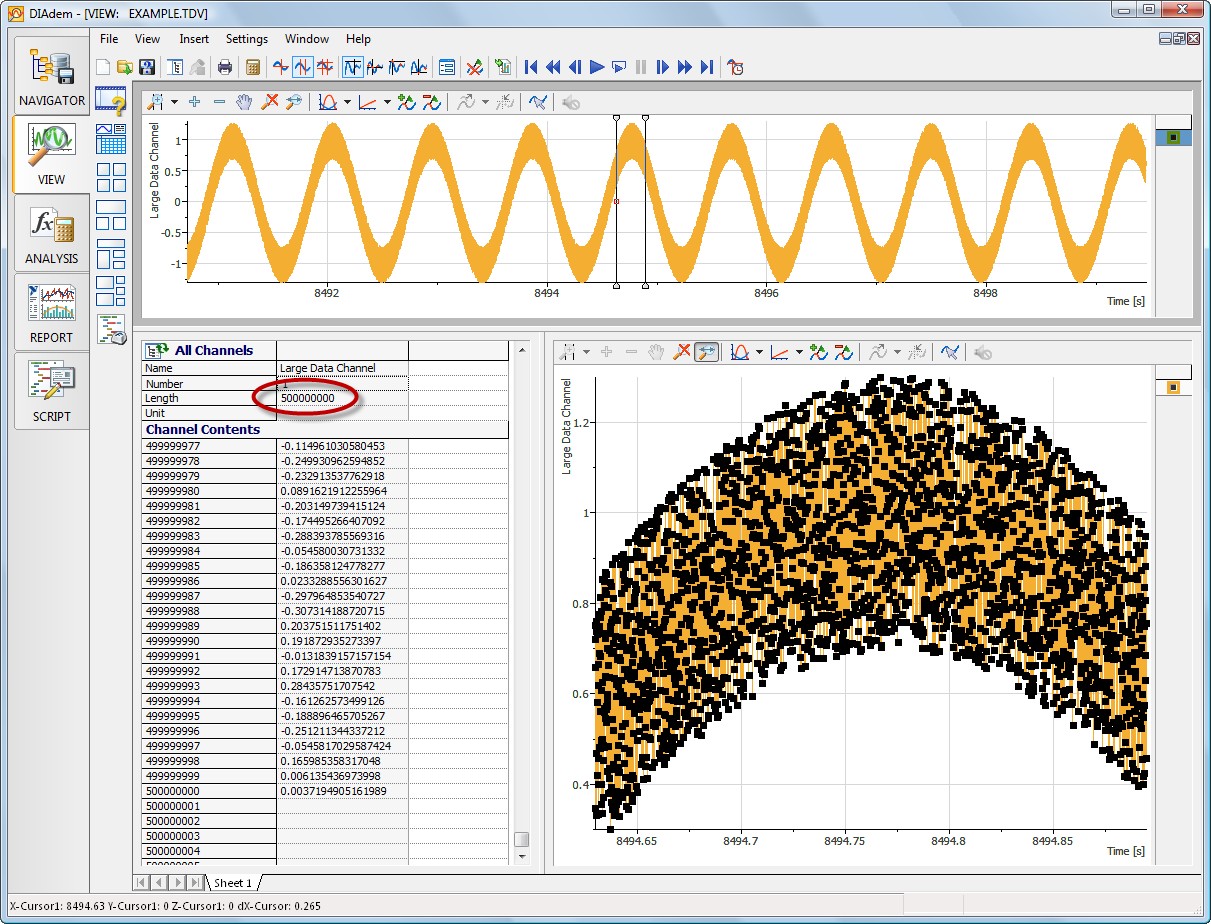
Figure 6. DIAdem can easily handle extremely large data sets. This image shows an example of 500,000,000 (one-half Billion) data points in a channel - 500 times the maximum number of rows allowed by Excel.
As shown in Figure 5, an acquisition rate of 1 MS/s using one single channel would exceed the number of data points that Excel could load in just over one second of acquisition. Many engineers and scientists feel forced to allow the limitations of their data post-processing software to dictate the terms of their acquisition and either reduce acquisition rates or segment acquisitions across numerous data files, introducing a nightmare for data management and organization.
DIAdem was designed to manipulate measurement data in both small and large volumes, and can process up to 2,000,000,000 data points (231) per channel across 65,536 (216) total data channels. Additionally, DIAdem includes selective loading, data reduction and register loading features specifically designed for working with extremely large data sets.
DIAdem can selectively load a subset of the data channels contained in a data file, whereas Excel always imports all of the columns from a data file. If you only need to load 1 channel from a very large data file with 10 channels in it, loading only the 10% of the data values that you actually need is much faster and more efficient than Excel's method of loading 100% of the data when 90% is overhead.
When files are loaded with data reduction, DIAdem loads data from a selected row range and/or condenses every N rows into one representative value, whereas Excel always loads all the data rows.
When files are register loaded, DIAdem uses the existing data file on disk as in-place virtual memory—DIAdem does not load all the values from the data file at once but instead registers how to access blocks of data values on-demand. This makes register loaded channels read-only, but it enables very quick graphing and inspection of extremely large data sets, as shown in Figure 6.
Applications collecting and saving data at high streaming rates must write data to disk using a streaming-capable file format. Binary file formats are most often utilized because they do not include the extraneous overhead required to make a file human-readable the way ASCII files do. A comparison of common file formats, including the open binary format standard to National Instruments software called Technical Data Management Streaming (TDMS), is displayed in Table 1.
| ASCII | Binary | XML | Database | TDMS | |
|---|---|---|---|---|---|
| Exchangeable | ✔ | ✔ | ✔ | ||
| Small Disk Footprint | ✔ | ✔ | |||
| Searchable | ✔ | ✔ | |||
| Inherent Attributes | ✔ | ✔ | |||
| High-Speed Streaming | ✔ | ✔ | |||
| NI Platform Supported | ✔ | ✔ | ✔ | ✔* | ✔ |
Table 1. There are many file format options available, but binary file formats such as TDMS are the only formats that are high-speed streaming capable. *May require a toolkit or add-on module.
DIAdem is flexible enough to read any custom file format – including customized binary file formats – due to modular pieces of code called DataPlugins that know how to parse and interpret the contents of a data file. DataPlugins also reformat the parsed data from the particular data file into a common data structure inside DIAdem, which makes it easy to compare data loaded from different file formats. National Instruments has published free downloadable DataPlugins for hundreds of the most commonly used data file formats, and there are published APIs for LabVIEW and VBScript for you to create DataPlugins for your own legacy data files. This enables DIAdem to be modular and scalable enough to handle any current, legacy, or future data file format choices.
By contrast, while Excel can read ASCII files, it is usually completely unable to load data from binary files. Even when Excel successfully loads an ASCII file, it has limited ability to correctly interpret the property and channel structure of the data file. Too often, time-consuming reformatting of the imported ASCII data is necessary before it can be used at all.
One exception to this problem is the TDMS file format from National Instruments, which Excel loads with correct formatting of the structure, properties, and data from the TDMS file, using the free TDM Excel Add-In.
Visit the TDMS homepage to learn more about the TDMS file format for storing measurement data to disk.
Over time, it is common to store and attempt to organize hundreds or thousands of data files on disk. These files are often stored in different ways using different formats, and may even be stored in varying locations on a local machine or across a network.
If you want to trend data across multiple data files using Microsoft Excel, you have to open each individual data file, copy the pertinent columns and paste them into a master (aggregated) file, and move onto the next data file. Accurately trending similar data channels across hundreds of unique data files could take days or weeks.
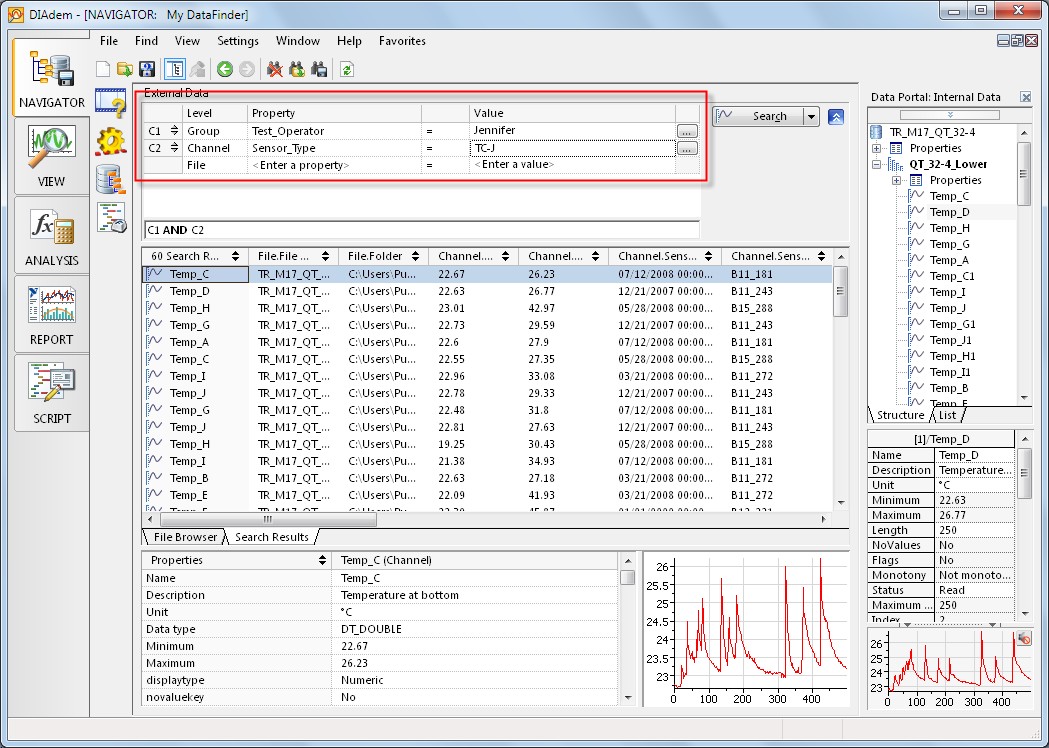
DIAdem can accomplish this same task in seconds. Using DataPlugins, DIAdem can load these different file formats to a common imported structure for uniform analysis and reporting. Furthermore, DIAdem installs a technology called My DataFinder that helps you quickly locate and isolate the exact data sets you are looking for, even if they are located across different files as shown in Figure 7. My DataFinder automatically creates an index of the descriptive information contained within data files which becomes searchable within DIAdem. Using DIAdem and DataFinder technology, you can quickly find all data files that were written by a particular operator, locate all failed tests, or even identify any data channels across all data files that were stored using a specific type of sensor. The more information you document in your data files, the more possibilities are available when searching for specific data stored across multiple files in various folders and/or file formats.
Figure 7. In this query, the DataFinder has located data channels across all data files that were collected using a J-Type thermocouple and stored to disk by Jennifer, the operator.
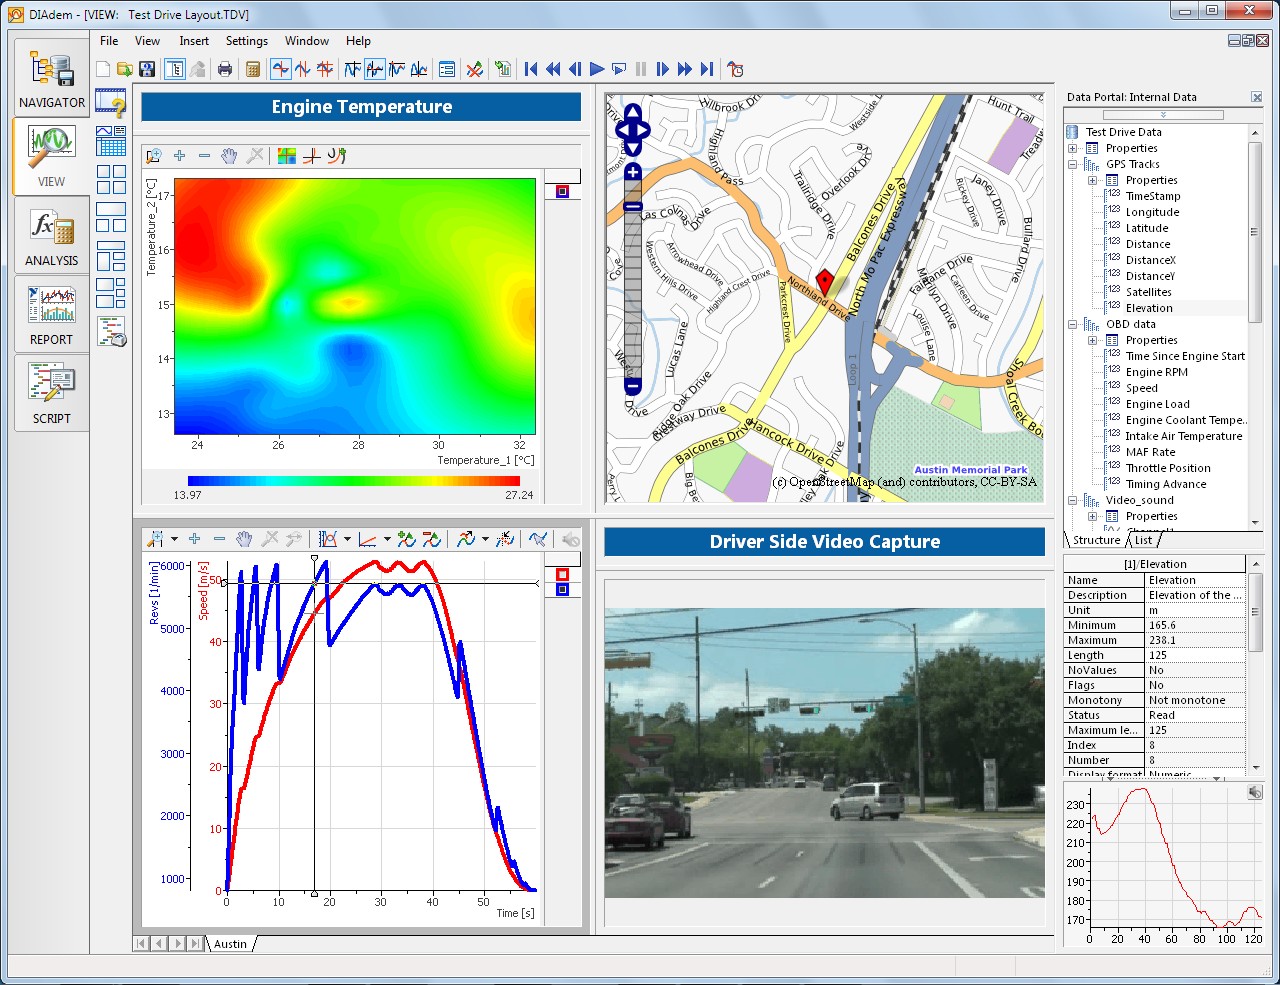
Microsoft Excel allows users to create basic charts and graphs, but static graphs do not allow you to fully interact with and inspect data that has been measured over time. For example, it is impossible to visualize correlated measurement data and GPS data using built-in tools in Excel. In order to completely characterize all aspects of time-based measurements, DIAdem includes a powerful visualization tool that features fully-synchronizable display areas ideal for playing back measurements coordinated with videos, 3D models, axis systems, GPS map displays, contours, sound playback, and more. This enables you to replay a measurement synchronized with other information to completely understand its context. DIAdem’s visualization tool also enables you to easily zoom into a specific region of a graph, copy or delete or interpolate data ranges, and examine the exact values of specific points graphically. Using this dynamic tool, it is easy to identify regions of interest or locate outliers within larger data sets.
Figure 8. Using DIAdem, you can fully synchronize the playback of measurement data, sound data, GPS coordinates, video, and more.
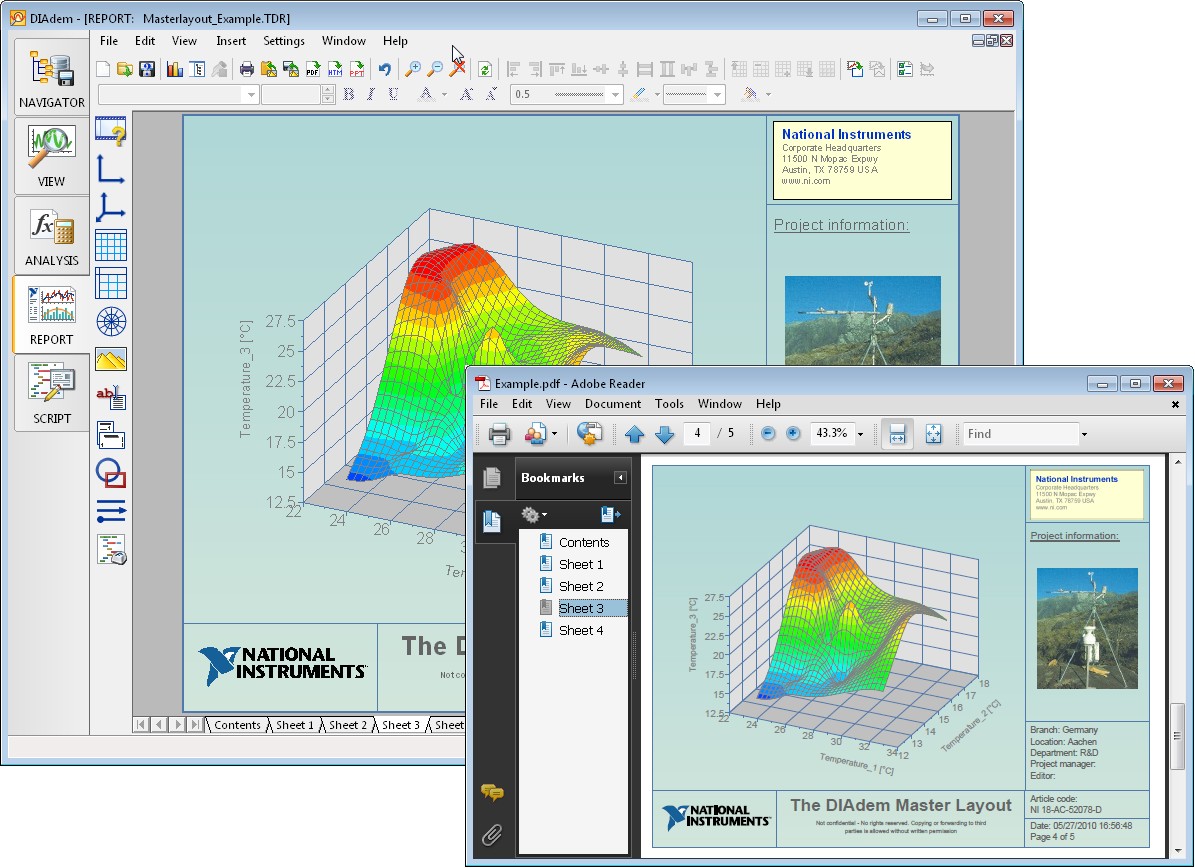
DIAdem features a robust reporting engine that leverages reusable templates because many engineers generate the same reports repeatedly using different data sets. The WYSIWYG report templates in DIAdem store references to data in memory as opposed to storing the actual data values themselves. To create reports of different data sets using the same stored report template, you can simply load the new data into memory and the loaded report template instantly updates its display with the newly loaded data values. You can then export completed high-resolution, publication-ready reports to the most common reporting formats including PDF, PowerPoint, HTML, image, and more. In Excel, the report display is saved along with the data in a common spreadsheet file, which makes it much harder to use a particular report display for multiple data sets.
Figure 9. DIAdem features a WYSIWYG report editor – publication-ready exported reports will look identical to their edit-time templates.
Excel provides a powerful environment for the development of macros. Using recording mode, it is possible to interactively record macros that automate lengthy evaluations or calculations. DIAdem similarly features an integrated VBScript editor, a user dialog editor, and a script recorder to interactively generate scripts that automate lengthy evaluations or calculations. Using scripting, the entire DIAdem environment can be customized and automated so that repetitive data workflow processes that used to take days can be accomplished in a matter of minutes. This truly maximizes the efficiency of engineers and scientists and dramatically reduces the time it takes them to turn raw measurement data into usable information.
Microsoft Office is used by approximately 80% of enterprises[1]. Many engineers and scientists view Excel as “free” software because it is installed on most enterprise computers without question. Often, scientists and engineers begin to use Excel for their analysis and reporting needs because it is familiar and available. When they encounter Excel’s limitations as summarized in Table 2, they either live with often repetitive and time consuming manual processing or spend hours and weeks developing and maintaining custom macro code.
If you estimate that personnel costs (including salary, insurance, equipment, etc) for one engineer total $100,000 annually, the cost to purchase one license of DIAdem Advanced and one entire week of training would be recuperated after just 2.8 work weeks of realized productivity gains over Microsoft Excel.
As detailed in this document, NI DIAdem quickly pays for itself by overcoming the limitations of Excel and introducing additional efficiency tools for managing, analyzing and reporting measurement data.
| Excel | DIAdem | |
|---|---|---|
| Building Block | Cell | Channel |
| Analysis Options | Extensive Financial Calculations | Extensive Engineering Calculations |
| Maximum Data Points | 1,048,576 rows | 2,147,483,648 rows |
| 16,384 columns | 65,536 columns (channels) | |
| Loading Large Data Sets | Always Loads 100% | Selective Loading, Data Reduction, Register Loading |
| File Formats | ASCII-Based | Any File Format |
| Data Management | NI DataFinder Technology | |
| Visualization and Inspection | Static Graphs and Charts | Synchronizable, Interactive Axis Systems, Videos, Sound, Maps, 3D Models, Contours |
| Reporting | Embedded Reporting Displays | Reusable WYSIWYG Report Templates |
| Automation | Macro Recording | Script Recording |
Table 2. DIAdem will increase your efficiency by overcoming the limitations of Microsoft Excel.
Use the resources below to learn more about moving beyond Excel to more powerful tools for measurement data analysis and reporting.
[1] "Forrester: Microsoft Office in No Danger From Competitors - PC World Business Center." http://www.pcworld.com. 2009-06-04. Retrieved 2009-12-19.