From Friday, April 19th (11:00 PM CDT) through Saturday, April 20th (2:00 PM CDT), 2024, ni.com will undergo system upgrades that may result in temporary service interruption.
We appreciate your patience as we improve our online experience.
From Friday, April 19th (11:00 PM CDT) through Saturday, April 20th (2:00 PM CDT), 2024, ni.com will undergo system upgrades that may result in temporary service interruption.
We appreciate your patience as we improve our online experience.
Under ideal conditions, an amplitude measurement’s accuracy will not depend on the input signal’s frequency. However, due to the non-ideal characteristics of real measurement devices, the measured amplitude of a signal can vary slightly according to its frequency. Analog Input (AI) flatness is a measure of how a device’s measurement response varies across its bandwidth. A perfect instrument would measure a 1 Vpk sine wave as exactly 1 Vpk regardless of the frequency of the sine wave as long as it was within the passband. However no instrument is perfect and you will always see some amplitude variation with frequency.
The AI Flatness specification provided for National Instruments DSA products tells you how much variation you can expect to see relative to the device’s measurement at 1 kHz. AI Flatness is a relative accuracy specification. It indicates gain error you may see in addition to the Gain Accuracy specification (which is also relative to 1 kHz and is provided in our specification documents). If you wanted to know the absolute Gain error across the full measurement bandwidth, you would need to add the AI Flatness to the AI Gain Amplitude Accuracy specification.
In order to measure AI flatness, you would need a function generator capable of maintaining a very accurate sine wave amplitude across the bandwidth of interest (20 Hz to 20 kHz/45kHz/92.2kHz). If you sweep this function generator across the bandwidth, you could expect to measure the same amplitude +/- the specified AI Flatness in units of dB reference the amplitude of the signal at 1 kHz.
The dynamic range of a device is the ratio of the largest and smallest signals that can be measured by circuit, normally expressed in dB.
Dynamic Range in dB = 20 * log10( Vmax / Vmin )
In most cases, the full scale input of a device is the largest signal that can be measured and the idle channel input noise determines the smallest signal that can be measured. National Instruments DSA devices specify Dynamic Range, Idle Channel Noise, and Spectral Noise Density, all of which can be used to calculate dynamic range. The easiest way to measure your device’s dynamic range is to take an idle channel noise measurement and convert that measurement to dB full scale, as described in KnowledgeBase 4X31Q728: How Do I Measure the Dynamic Range of My Data Acquisition Device?
Dynamic range is a very important quantity to consider when choosing a DSA device. Oftentimes, DSA applications require the use of microphones and accelerometers- sensors that have very large dynamic ranges. Choosing an appropriate measurement device will allow you to take advantage of these sensors and the fullness of their range.
Note: When comparing dynamic range specifications between devices, it is very important to make sure that the measurement bandwidth, sample rate, input range and input tone are identical. If any of these vary, the dynamic range comparison will be misleading.
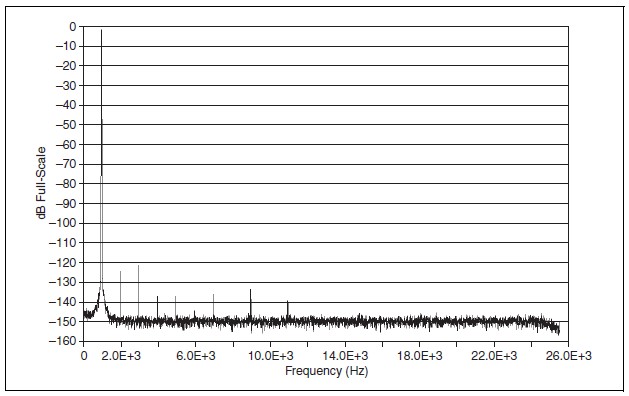
When dealing with DSA hardware you are very likely to encounter a number of distortion related specifications. In order to understand these measurements, begin by taking a look at a typical Fast Fourier Transform (FFT) graph.
Figure 1: Typical FFT Plot with the NI 446x device
This FFT was taken with a NI 446X device at a sample rate of 51.2 kS/s with a -1 dBFS (dB Full Scale) amplitude sine wave at 1kHz. There are several features of this FFT to consider when talking about distortion measurements:
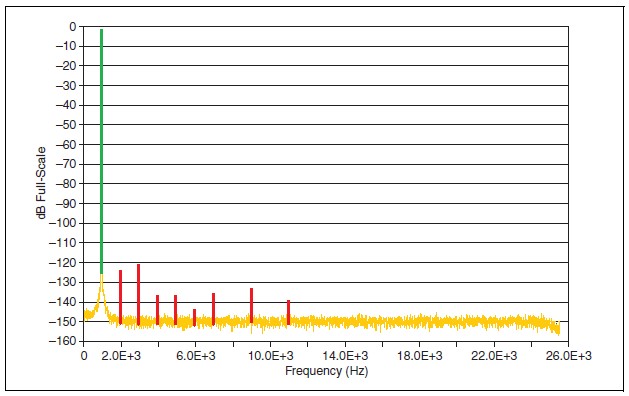
Figure 2: Color Coded FFT Plot
Distortion measurements can easily be illustrated using an FFT like the one in Figure 2. THD, THD+N and SINAD are different ratios of the power in these three illustrated signals (Fundamental, Harmonics and Noise).
THD = ∑Power (harmonics) / Power (fundamental)
THD + N = ∑Power (harmonics) + ∑Power (noise)) / Power (fundamental)
SINAD = (Power (fundamental) + ∑Power (harmonics) + ∑Power (noise) )/ (∑Power (harmonics) + ∑Power (noise))
When sampling signals at a given frequency, fs, only frequency components less than or equal to half the sample rate will be represented correctly in an FFT (<= fs/2). Signals with a frequency greater than fs/2 will be “aliased” back into the frequency band between 0 and fs/2. If signal aliasing occurs, there is no way to tell in band (0 to fs/2) signals from out of band (greater than fs/2) signals.
In order to prevent signal aliasing and accurately represent the frequency content in the 0 to fs/2 band, National Instruments DSA devices implement an oversampling architecture that allows for sample rate dependent filtering (as the sample rate changes, so will the cut off frequency of the filter). As a result, DSA devices have Bandwidth and Alias Rejection specifications that prevent signals from being aliased.
For more information on these anti-aliasing filters, please see the Analog Input Filters section in Chapter 2 of the Dynamic Signal Acquisition User Manual.
For full description of signal aliasing, please see Acquiring an Analog Signal: Bandwidth, Nyquist Sampling Theorem, and Aliasing.
Generally speaking, synchronization is important in DSA applications because it allows for accurate phase comparisons between channels in systems ranging from 2 to 10,000 channels. Phase comparisons are critical in many sound and vibration applications, including noise mapping. As channel count increases, more DSA devices will be required, and synchronizing these devices becomes necessary.
The steps required to synchronize DSA devices vary depending on the specific device and platform. Synchronization is covered in more detail in the Tutorial: Dynamic Signal Acquisition (DSA) Synchronization Basics and Chapter 2 of the Dynamic Signal Acquisition User Manual.