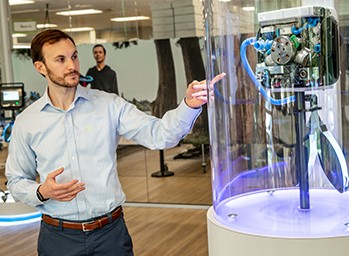
Preclinical Multimodal Imaging for Cancer Research

"We can combine anatomical information and functional images by integrating the advantage of spectral CT and fluorescence. If it had not been for NI products, we could not have developed this multimodal imaging system."

- Dr. Seung-Oh Jin, Korea Electrotechnology Research Institute

The Challenge:

Developing novel multimodal preclinical imaging system that includes multimodal system integration, a photon counting detector, high-precision gantry control, image fusion, and data communication for cancer research.

The Solution:

Reducing the time needed to develop and test the multimodal imaging system from six months to two months by using LabVIEW and NI hardware.

Author(s):

Dr. Seung-Oh Jin - Korea Electrotechnology Research Institute
Dr. Ki-Young Shin - Korea Electrotechnology Research Institute
Dr. Young-Min Bae - Korea Electrotechnology Research Institute
Dr. Dong-Goo Kang - Korea Electrotechnology Research Institute
Jeong-Seok Lee - Korea Electrotechnology Research Institute


Introduction

The Korea Electrotechnology Research Institute (KERI) is a government-funded research institute of South Korea and is specialized in the advancement of scientific technology and industrial development of the electric power, electricity and electric utility fields. With the accumulated technological power and expertise, the KERI intends on developing advanced fusion technologies, converging traditional technologies with IT, NT, and ET. For the past 20 years, the KERI has accumulated a vast range of capabilities and knowledge for advanced medical image-based diagnosis system including Digital Radiography (DR), Computational Tomography (CT), Magnetic Resonance Imaging (MRI) and optical imaging.


The purpose of this project is to develop the multimodal system with the spectral CT and optical fluorescence imaging (FI). The key problems in the project were to resolve the issues for controlling the high-precision gantry for CT, positioning the optical filters for FI, and combining the multimodal images into a single user interface. In detail, the imaging system was composed of seven motors, an X-ray tube, a photon counting detector (PCD) for spectral CT, a high sensitive camera and a light source. They should be controlled in the PC-based interface through different types of communication such as Ethernet, USB, RS232, and digital I/O.


Appearance of the Hardware Application

Figure 1 shows the prototype of the multimodal imaging system in this project. The dimensions of the system are 95 cm x 99 cm x 175 cm (37.4 in. x 38.9 in. x 68.9 in.). Three LEDs on the front panel represent the operation states of the core components inside the system such as the camera, the X-ray tube, and power management, and there is a red color switch for shutdown in case of an emergency. The protrusion on the front surface of the system represents a motor-driven sliding door, inside which a bed for an animal sample is located. The sample placed on the bed is automatically transported to the inside of the system, and then, the fluorescence images and X-ray images are acquired in sequence after the door is closed completely due to open/close monitoring sensors attached on the sliding door.


Figure 2 shows the inside structure of the system. The first floor features an electronic circuit for motor control, a chiller for cooling PCD, and a thermal sensor to monitor temperature. The second floor features a rotating gantry for taking the CT, an X-ray tube, an X-ray detector, a sample bed (couch), and an acceleration sensor to monitor the gantry vibration. The third floor includes a high sensitive camera mounted with optical filters, a lighting source, and the most important devices for fully controlling the systems (PXle-1073, PXI-7352, PXI-7334, and PXIe-6363).


We covered the second floor of this device with 3 mm of lead to prevent X-ray radiation leakage. The maximum output of the X-ray tube is 80 kV, 0.7 mA, but it has a similar leakage of 0.1 uSv/hr when examining with the maximum level of X-ray, comparable to natural background radiation. This leakage satisfies the standard of IEC 61010-1 in which the allowed level is under 5 uSv/hr.  


Figure 3 shows the block diagram of the control system. The PXIe-1073 mounted with the PXI-7352, PXI-7334, and PXIe-6363 devices were connected to the control PC. The PXI-7352 and PXI-7334 devices are used for motion control devices. They play an important role in controlling the rotational motor in the CT gantry, of which the resolution is 0.5 degrees satisfying the precision 0.01 degrees. The rotational position of the gantry are controlled with a precision encoder with a resolution of 0.0025 degrees.


The PXI-7334 device controls four main actuators: 1) the zoom stage motor for adjusting the distance between the X-ray tube and the object, 2) the bed stage motor for transporting a sample, 3) the lead gate motor for X-ray shielding between the second and third floor, and 4) the balance load motor for adjusting the center of mass in the rotating gantry.


The PXIe-6363 collects the data from three types of sensors: 1) the interlock sensors to check the open/close state of the sliding door, 2) the two temperature sensors to monitor the temperature of the first and third floor, and 3) the acceleration sensor to estimate the vibration of the rotational gantry. In addition, it controls the front LED via the digital I/O ports.


The other parts are directly communicated with the control PC. The PCD, which is a key detector for X-ray image and spectral CT image, uses Ethernet communication protocol. The chiller and the light source communicate using the RS232 protocol, the camera communicates with the PC using USB 3.0 protocol. The user interface (UI) to totally operate the imaging system was developed using the LabVIEW software on PC.


LabVIEW UI

Figure 4 shows the display of the UI with multiple window panels, of which each display the state of the system and provides the input cursor for the motion control, the X-ray tube and detector, and, the camera and light source. In the acquisition window, a fluorescence image, an X-ray image, and a spectral CT image was acquired and displayed according to selecting image modality. In addition, there are stitching functions and 2D co-registration functions of fluorescence/X-ray images for the whole body image of a mouse in processing windows.


Verification of Fluorescence Image Using Phantom

The System verification such as the motor control, the acquisition of images, and more, were executed with a mouse-featured phantom. The size of the mouse-featured phantom is similar to the size of a real nude mouse.


Figure 5 shows the mouse phantom lid on the moving bed. After the phantom was transported to the inside of the system, the optical images were acquired in several bands. The spectral bands are automatically selected by controlling the position of the optical filter mounted inside the camera. Figure 6 shows the mouse phantom images acquired successfully in the spectral bands of 440 nm, 540 nm, 640 nm, and 720 nm.


Preclinical Animal Study

Fluorescence, X-ray, and CT images of the nude mouse (Balb/c nu/nu) with human tumor cells on its skin were acquired under the Institutional Animal Care and Use Committee (IACUC) approval of preclinical animal studies. To take the fluorescence images, an anticancer frug labeled with fluorescence that reacts to the tumor cells was injected into the tail vein of the mouse (Figure 7).


Figure 8 shows the fluorescence images of the nude mouse. In the figures, the area of breast tumor cells was brighter than other areas due to the fluorescence emission (Study 1 in Figure 8), which meant that the anticancer drug was well tagged in the tumor cells. In further study, the brightness due to fluorescence increased as increased concentrations of the anticancer drug were injected, as shown in Study 2 in Figure 8.


The X-Ray Image and Stitching Result

Since the sensing area of the PCD used in this project was 6 cm x 3 cm (2.36 in. x 1.18 in.), four partial images are needed to acquire a full body image of the mouse (10 cm or 3.93 in. without the length of its tail), and those images must be stitched into a single image. In this study, to improve stitching performance, six partial images were acquired, and then stitched. Figure 9 shows the window for stitching process in the UI program. In this interface, six partial images are acquired, and the stitching process was automatically executed by pressing a button.


Co-Registration of Fluorescence and X-Ray Image

The co-registration function was implemented to gather functional information of fluorescence and anatomical information of the X-ray at the same time. Figure 10 shows a typical example of co-registration between fluorescence and X-ray using the developed co-registration method in this application.


Computed Tomography Result

To obtain the CT images, 360 raw data at an interval of 1 degree was acquired with the UI, and the tomographic image was reconstructed with the program code separated from the UI. In addition, the UI provides a 2D plot of tomographic images in their present states. Figure 11 is a reconstructed CT image of a mouse pelvis. In the figure, the bed (crescent shape), the mouse soft tissue (gray area), and the hard tissue (white region) could be discriminated definitively.


Spectral CT Image

Spectral CT can possibly extract a desired energy wavelength image compared to other common CT. We may be able to acquire distinct CT images from the object using the phantom that contained three different materials as shown in Figure 12(A). Figure 12(B) shows the reconstructed image acquired with the conventional CT scanner. Figure 12(C) shows the image of distinct iodine through the function of spectral CT. In addition, Figure 12(D) represents the image of distinct CuSO4.


The Advantage of This Application

Conventional CT scanner show only white or dark images, which means we see limited information, and therefore it is impossible to see soft tissue or hard tissue images separately. However, if we use the spectral CT technique, we can see soft tissue or hard tissue images separately. Moreover, we can reconstruct the image with or without contrast agents. The spectral CT image can provide meaningful information clinically and this image cannot be observed in the common CT image.


We can combine anatomical information and functional images by integrating the advantage of spectral CT and fluorescence. If we did not use NI products (motor controller, DAQ device, and control chassis), we could not have developed this multimodal imaging system. The PXIe-1073 device proved especially helpful to connect PC to devices, which prevented many difficulties during application development. We wanted a simple structure without an OS or embedded system. This application is an essential system in new drug development, medical fluorescence development, and new medical diagnosis/treatment technology development. It can deliver new diagnosis image information that cannot be seen in previous CT and fluorescence imaging systems.


This application is a world-first device that integrates the spectral CT and the body fluorescence imaging systems. We finished all processes including the system design, developing a multimodal system, verifying the system, and preclinical animal study in only eight months. We could not have finished within eight months without NI products, including LabVIEW software.


Conclusion

NI products (LabVIEW software, NI motor controller, DAQ device, and integration chassis) played a crucial role in developing and integrating two modality images—spectral CT and body fluorescence imaging. A verified NI platform improved coordination between the LabVIEW program development team and the hardware team.


In the future, we will conduct research to improve the software modules (3D spectral CT reconstruction algorithm, volume rendering, and user friendly UI) of this application. We will keep pace with pharmaceutical companies and colleges of pharmacy to plan on the development of new drugs or new materials for cancer treatments. We expect that users of our system will find new drugs for cancer treatment in the near future. Moreover, we will visualize the effect of new drugs using this application and provide new imaging diagnostic techniques.


Acknowledgements

This work was supported by Korea Electrotechnology Research Institute (KERI) primary research program through the National Research Council of Science & Technology (NST) funded by the Ministry of Science, ICT and Future Planning (MSIP) (No. 16-12-N0101-50 and No. 17-12-N0101-54).


Author Information:

Dr. Ki-Young Shin
Korea Electrotechnology Research Institute 
Tel: +82 31 8040 4153
kyshin@keri.re.kr


Author Information:

Dr. Seung-Oh Jin
Korea Electrotechnology Research Institute
Tel: +82 31 8040 4152
sojin@keri.re.kr

Figure 1. Appearance of the Hardware Application
Figure 2. Location of Main Parts
Figure 3. Block Diagram of the Control System
Figure 4. Multi-Window User Interface
Figure 5. Mouse Phantom for System Verification
Figure 6. Optical images in the Various Spectral Bands
Figure 7. Preclinical Animal Study
Figure 8. Preclinical Animal Study Results
Figure 9. Image Stitching
Figure 10. Co-Registration Result
Figure 11. CT Image
Figure 12. Material Decomposition Using Spectral CT