Excel Insert Graph VI
- Updated2024-07-30
- 4 minute(s) read
Inserts a new graph into the current worksheet and fills the graph with numeric data.
Inputs/Outputs
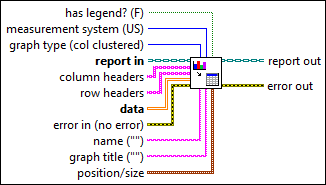
 has legend? (F)
—
has legend? (F)
—
has legend? shows or hides the graph legend. The default is FALSE, in which the VI does not display the graph legend.  measurement system (US)
—
measurement system (US)
—
measurement system determines the system that the VI uses to measure size.  graph type (col clustered)
—
graph type (col clustered)
—
graph type sets the type of graph the VI creates. The default is a column graph. You can select one of 65 types of graphs, including XY (scatter), line, bar, three-dimensional surface, pie, and area graphs.  —
—
report in is a reference to the report whose appearance, data, and printing you want to control. Use the New Report VI to generate this LabVIEW class object.  column headers
—
column headers
—
column headers specifies the text of the column labels on the graph. Leave this parameter unwired if you want to create an XY graph.
row headers
—
row headers specifies the text of the row labels on the graph. Leave this parameter unwired if you want to create an XY graph.  data
—
data
—
data contains numerical data that the VI uses to create the graph. Microsoft Office returns an error if you plot more than 3,999 points per row or column.  error in (no error)
—
error in (no error)
—
error in describes error conditions that occur before this node runs. This input provides standard error in functionality.  name ("")
—
name ("")
—
name specifies a named range from which the VI inserts the graph. The top left corner of the graph appears in the top left corner of the named range.
graph title ("")
—
graph title contains the title of the graph.  position/size
—
position/size
—
position/size sets the position and size of the graph into the current worksheet. The position represents the row and column indexes of the cell from which the VI inserts the graph.
 —
—
report out is a reference to the report whose appearance, data, and printing you want to control. You can wire this output to other Report Generation VIs.  error out
—
error out
—
error out contains error information. This output provides standard error out functionality. |
 height
—
height
—