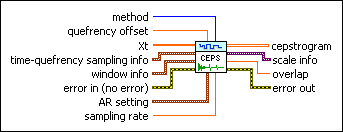
TSA Time-Cepstrum VI
- Updated2023-02-21
- 9 minute(s) read
TSA Time-Cepstrum VI
Owning Palette: Correlation and Spectral Analysis VIs
Requires: Advanced Signal Processing Toolkit
Computes the single-sided time-cepstrum of a univariate time series by using a sliding window. You can use the resulting time-cepstrum to detect time-varying periodic components of a time series. Wire data to the Xt input to determine the polymorphic instance to use or manually select the instance.
TSA Time-Cepstrum (Waveform)

 |
method specifies whether this VI uses the FFT-based or the autoregressive (AR) model-based method to compute the real cepstrum. The default is FFT. | ||||||||||||||||||||||||||
 |
quefrency offset specifies the offset, in seconds, of the quefrency. This VI returns the real cepstrum at a certain time whose quefrency is larger than the offset value. The default is 0. | ||||||||||||||||||||||||||
 |
Xt specifies the univariate time series. | ||||||||||||||||||||||||||
 |
time-quefrency sampling info specifies information about the density and the size of the time-cepstrum.
| ||||||||||||||||||||||||||
 |
window info specifies the information about the sliding window that divides the time series Xt into subsequences.
| ||||||||||||||||||||||||||
 |
error in describes error conditions that occur before this node runs. This input provides standard error in functionality. | ||||||||||||||||||||||||||
 |
AR setting specifies the settings for the autoregressive (AR) model. This option is valid only when the method is AR Model.
| ||||||||||||||||||||||||||
 |
cepstrogram returns the time-quefrency representation of the time series Xt. Each row corresponds to the real cepstrum at a certain time. The number of rows in cepstrogram equals the signal length divided by time steps. You can use the TSA Get Time and Quefrency Scale Info VI to compute the time scale information and the quefrency scale information of the time-quefrency representation. | ||||||||||||||||||||||||||
 |
scale info returns the time scale and quefrency scale information of the time-quefrency representation, including the time offset, the time interval between every two contiguous rows, the quefrency offset, and the quefrency interval between every two contiguous columns of the cepstrogram. | ||||||||||||||||||||||||||
 |
overlap returns the overlap, in percentage, of the sliding window this VI applies to the time series. | ||||||||||||||||||||||||||
 |
error out contains error information. This output provides standard error out functionality. |
TSA Time-Cepstrum (Array)

 |
method specifies whether this VI uses the FFT-based or the autoregressive (AR) model-based method to compute the real cepstrum. The default is FFT. | ||||||||||||||||||||||||||
 |
quefrency offset specifies the offset, in seconds, of the quefrency. This VI returns the real cepstrum at a certain time whose quefrency is larger than the offset value. The default is 0. | ||||||||||||||||||||||||||
 |
Xt specifies the univariate time series. | ||||||||||||||||||||||||||
 |
time-quefrency sampling info specifies information about the density and the size of the time-cepstrum.
| ||||||||||||||||||||||||||
 |
window info specifies the information about the sliding window that divides the time series Xt into subsequences.
| ||||||||||||||||||||||||||
 |
error in describes error conditions that occur before this node runs. This input provides standard error in functionality. | ||||||||||||||||||||||||||
 |
AR setting specifies the settings for the autoregressive (AR) model. This option is valid only when the method is AR Model.
| ||||||||||||||||||||||||||
 |
sampling rate specifies the sampling rate, in hertz, of the univariate time series Xt. The default is 1. | ||||||||||||||||||||||||||
 |
cepstrogram returns the time-quefrency representation of the time series Xt. Each row corresponds to the real cepstrum at a certain time. The number of rows in cepstrogram equals the signal length divided by time steps. You can use the TSA Get Time and Quefrency Scale Info VI to compute the time scale information and the quefrency scale information of the time-quefrency representation. | ||||||||||||||||||||||||||
 |
scale info returns the time scale and quefrency scale information of the time-quefrency representation, including the time offset, the time interval between every two contiguous rows, the quefrency offset, and the quefrency interval between every two contiguous columns of the cepstrogram. | ||||||||||||||||||||||||||
 |
overlap returns the overlap, in percentage, of the sliding window this VI applies to the time series. | ||||||||||||||||||||||||||
 |
error out contains error information. This output provides standard error out functionality. |
Example
Refer to the Bearing Time-Cepstrum Analysis VI in the labview\examples\Time Series Analysis\TSAApplications directory for an example of using the TSA Time-Cepstrum VI.
