Append Text Table to Report (wrap) VI
- Updated2025-07-30
- 4 minute(s) read
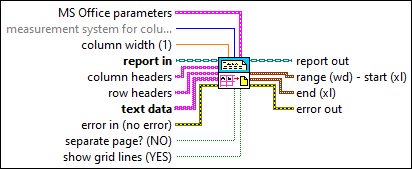
Appends a 2D array to a report as a table with the given column width. Wire data to the text data input to determine the polymorphic instance to use or manually select the instance.
Inputs/Outputs
 MS Office parameters
—
MS Office parameters
—
MS Office parameters (Report Generation Toolkit) specifies the point in a Microsoft Word or Excel report where you want an insertion to occur. The VI ignores this input for HTML reports.
 measurement system for column width (Default)
—
measurement system for column width (Default)
—
measurement system for column width determines whether the value you enter in column width is in inches or centimeters.  column width (1)
—
column width (1)
—
column width defines the width of each column in the report table.  report in
—
report in
—
report in is a reference to the report whose appearance, data, and printing you want to control. Use the Create Report VI to generate this LabVIEW class object.  column headers
—
column headers
—
column headers determines how each column is labeled in the table.
row headers
—
row headers determines how each row is labeled in the table.  text data
—
text data
—
text data is the information you want to be printed in tabular form.  error in (no error)
—
error in (no error)
—
error in describes error conditions that occur before this node runs. This input provides standard error in functionality.  separate page? (NO)
—
separate page? (NO)
—
separate page? specifies whether to place the table on a new page of the report. The default is FALSE.
show grid lines (YES)
—
show grid lines specifies whether to display the grid lines of the table. The default is TRUE.  report out
—
report out
—
report out is a reference to the report whose appearance, data, and printing you want to control.  range (wd) - start (xl)
—
range (wd) - start (xl)
—
range (wd) - start (xl) (Report Generation Toolkit) indicates the place where the VI inserts the table.
end (xl)
—
end (xl) (Report Generation Toolkit) indicates the last cell in the Excel worksheet where the VI inserts the table.
 error out
—
error out
—
error out contains error information. This output provides standard error out functionality. |
 position (excel)
—
position (excel)
—
 row
—
row
—
 name (excel)
—
name (excel)
—
 start (wd) - row (xl)
—
start (wd) - row (xl)
—
Examples
Refer to the following example files included with LabVIEW.
- labview\examples\reports\TextReportExample.llb\Text Report Example.vi