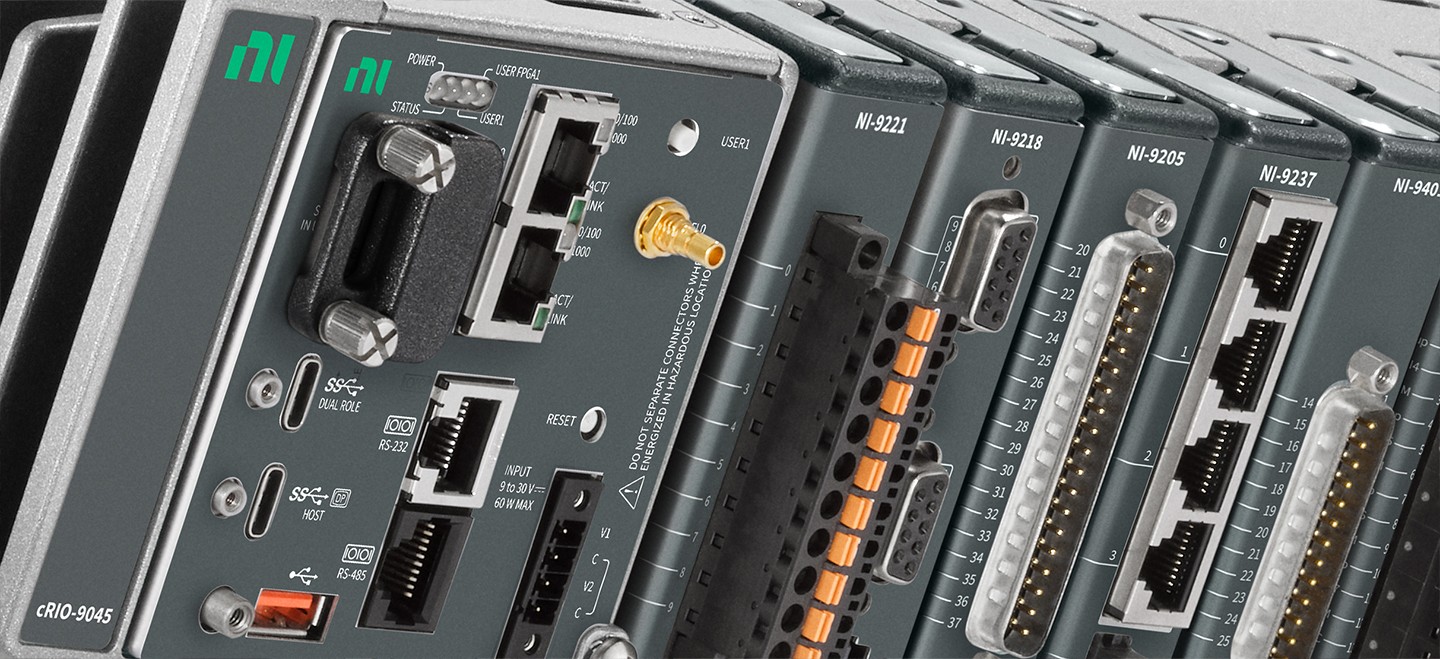
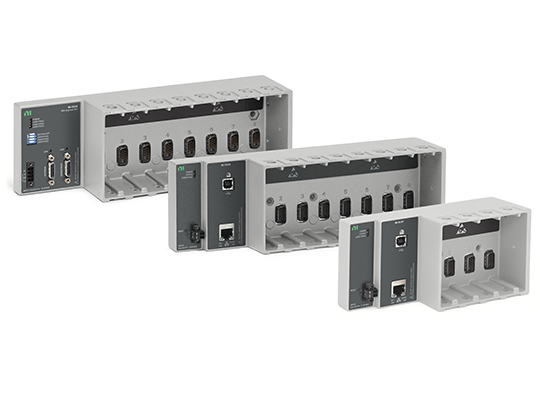
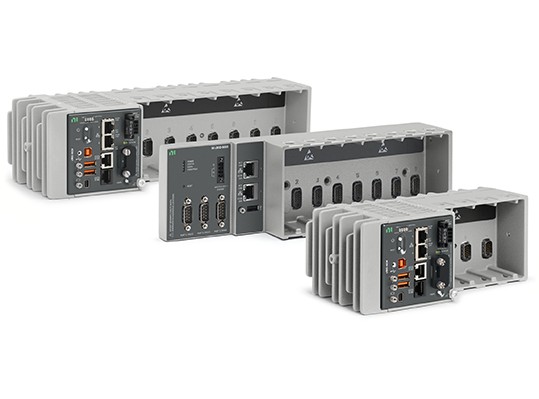
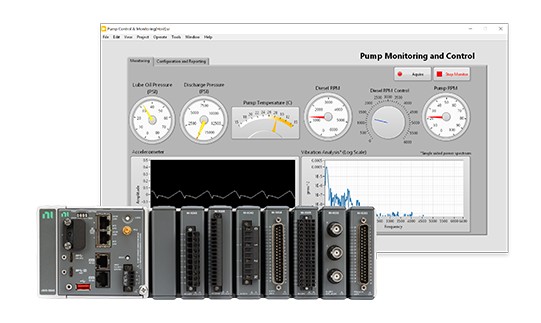
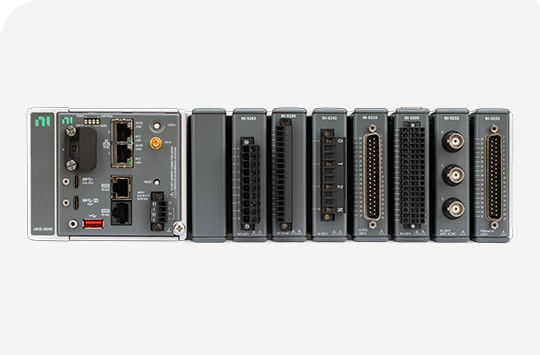
1. High Availability Systems
The automotive, industrial, defense and aerospace industries often use real-time systems for both test and control. In the area of test, applications range from life-cycle endurance testing of aircraft components to autonomous instruments with stand-alone operation in remote areas. In these mission-critical applications, a computer crash is not acceptable because the relevant data may require months of observation during environmental testing. Re-running such tests is potentially expensive or even impossible.
In the area of control, determinism and reliability are essential. For example, closed-loop control applications, such as a cruise control system, require precise updates to the engine throttle based on the measured speed and the results of a control algorithm such as PID. For automation and industrial control applications, deterministic timing is required to ensure appropriate motion paths and responses during the manufacturing process.
The CompactRIO and Compact FieldPoint products from National Instruments (NI) are designed, manufactured, and tested with the goal of delivering the highest quality products for these High Availability Applications.
2. Real-Time Development Best Practices
The following section discusses several tools that are useful to designers of High Availability systems along with good Real-Time programming practices essential for such systems. Additional information and concepts can be found in the LabVIEW Real Time Module Concepts help and on the LabVIEW DevZone for Advanced LabVIEW Real-Time Development Resources and Benchmarks.
Tools for Debugging High Availability Systems
Profile Performance and Memory Window
The Profile Performance and Memory window is a powerful tool for statistically analyzing how an application uses execution time and memory. You can use the Profile Performance and Memory window to display performance information for all VIs and subVIs in memory. This information can help you optimize the performance of your VIs by identifying potential bottlenecks. Select Tools»Profile»Performance and Memory to display the Profile Performance and Memory window.
Debug Application or Shared Library Dialog Box
Use the Debug Application or Shared Library dialog box to debug stand-alone real-time applications running on an RT target. The Debug Application dialog box will also allow you to view the block diagram of the application, run the application in “highlight execution” mode, probe inputs and outputs, and allow the use of other debugging tools.
Real-Time Benchmarking VIs
Timing is crucial in a deterministic application. LabVIEW Real-Time ships with a Real-Time Benchmarking VI to help verify correct timing behavior. This VI uses the RT Get Timestamp VI and the RT Timestamp Analysis VI to benchmark the performance of VIs and sections of VIs running on an RT target. You can use the benchmark information to optimize the design of RT target VIs. See the NI Example finder to locate the Real-Time Benchmarking VIs.
Real-Time Execution Trace Toolkit
The Real-Time Execution Trace Toolkit is a real-time event and execution tracing tool that allows you to capture and display the timing and event data of VI and thread events for LabVIEW Real-Time Module applications. The Real-Time Execution Trace Toolkit includes the Real-Time Execution Trace Tool and the Execution Trace Tool VIs. You can use the Execution Trace Tool VIs to capture the timing and execution data of VI and thread events for applications running on an RT target. The Real-Time Execution Trace Tool displays the timing and event data on the host computer for analysis.
Monitoring Real-Time Target Resources
The Real-Time System Manager displays details about VIs running on an RT target and provides a dynamic display of the memory and CPU resources for the target. In some cases, application timing failures are caused by insufficient memory or CPU resources on the RT target. Select Tools»Real-Time Module»System Manager to launch the Real-Time System Manager.
Error Handling, Logging Errors and Boot Conditions
No matter how confident you are in the VI you create, you cannot predict every problem a user can encounter. Without a mechanism to check for errors, you know only that the VI does not work properly. Error checking tells you why and where errors occur. Use the error cluster controls and indicators to create error inputs and outputs in subVIs.
The error in and error out clusters include the following components of information:
1. Status
2. Code
3. Source
Since CompactRIO, Compact FieldPoint, and FieldPoint applications usually do not have a user interface there will not be an indication of when an error occurs. Therefore, it is important to store these errors in a log file on the controller that can later be retrieved. You can use error log files to store information about LabVIEW errors and/or unexpected data. A simple error logging implementation is shown below in Figure 1.
Figure 1: Simple Error Logging Implementation with FieldPoint
In addition, RT controllers will automatically generate an error log if the controller crashes. You can access this error log by right-clicking on the controller in Measurement & Automation Explorer, under Remote Systems and selecting View Error Log. The error log is stored in the following directory on the controller: /ni-rt/system/errlog.txt. Log the time your controller boots up. If you also log the time when an error occurs, you can determine the amount of time the RT application ran without any errors.
Common Real-Time Application Failures
Avoiding Shared Resources
In LabVIEW, there are resources that two or more VIs might need to share. Shared resources can cause jitter and prevent applications from taking advantage of multiple CPUs. Common examples of shared resources include: global variables, non-reentrant subVIs , The LabVIEW memory manager , Queue Operation functions, Semaphore VIs, and Single-threaded DLLs. For example, when a VI allocates memory, the VI accesses the LabVIEW memory manager. The LabVIEW memory manager allocates memory for data storage. The LabVIEW memory manager is a shared resource and might be locked by a mutex for up to several milliseconds. Allocating memory within a deterministic VI can affect the determinism of the VI.
Avoiding Contiguous Memory Conflicts
LabVIEW handles many of the memory details that you normally deal with in a conventional, text-based language. For example, functions that generate data must allocate storage for the data. When that data is no longer needed, LabVIEW deallocates the associated memory. When you add new information to an array or a string, LabVIEW allocates new memory in a new memory space to accommodate the new array or string. Due to the limited memory on RT Targets, running out of memory can be a great concern.
Safe Shutdown Procedures for Real-Time Targets
Many times CompactRIO and FieldPoint applications are written without considering how to safely shutdown the application and instead are stopped abruptly. In rare occasions shutting down abruptly can cause a FAT corruption which in some cases can cause parts of the Real-Time OS or drivers to become corrupted. A corruption would be cause the need to reinstall Software and the application to the Real-Time device. One easy means of avoiding this potential failure is to have a procedure for safe shutdowns. Using hardware (Digital IO or a DIP switch) to trigger the stop button of the program's while loops are simple ways to insure safe shutdowns. Alternatively, use of a UPS (uninterruptible power supply) coupled with DIO (to read a line which indicates whether the UPS is on battery power) could automatically power the machine, trigger the stop condition and keep power on until the VI has exited.
To help explain how a corruption can happen, an overview of how FAT32 works is beneficial. FAT stands for File Allocation Table. Think of this as a map. At the beginning of the hard drive, there is a table saying which file is stored in which physical section of the drive. When a file is being written in FAT32, if the file exceeds its allocated spacMae, then the file and the table will need to be written. This is where corruption can happen. If the hard drive is powered down before the table can be written, then the map is rendered inaccurate. This means that the file being written (And all files stored on later addresses on the hard drive) won't be correctly read. Imagine that all files shift one address to the right. Now the file being written is stored in the wrong place, but also every file after it is in the wrong place. A program without any explicit File IO programmed into it should be safe from a FAT corruption as any internal files are written only on bootup and driver loading, and not at run-time.
3. Watchdogs and System Monitoring
WatchDogs
In real-time applications, deterministically responding to failures or system events is sometimes necessary. If a critical component of a motion control system fails, keeping the motor running might risk the safety of both the equipment and operators. While shutting down the equipment as quickly as possible might be the best solution, not every failure needs to be handled in this manner. When a network connection between an embedded data-logging application and a host machine fails, it is possible to continue running the real-time application and log to a disk until the network connection is reestablished.
Watchdogs are utilities that monitor for specific system events and failures. These utilities can be either software or hardware, where available. The watchdog waits until a specific event occurs and executes a preconfigured action. The network watchdog checks the system for network disturbances and responds to a connection failure.
All CompactRIO, FieldPoint and Compact FieldPoint controllers have built-in network monitors. If you enable the network watchdog and the controller loses communication with all hosts or clients over the network, controller sets the output channels to predefined values corresponding to the watchdog state. With FieldPoint and Compact FieldPoint you can configure these watchdogs to output a certain value when a network failure is detected as shown below in Figure 2.
Figure 2: Watchdog Configuration for FieldPoint I/O
Using the FPGA as a Hardware Watchdog in CompactRIO
You can also utilize CompactRIOs FPGA as a Watchdog by using a separate FPGA loop with a down counter that is reset from the Real-Time Host VI. Use the FPGA Digital Output line for System Reset to reset the Real-Time controller and the FPGA VI can be configured to continue to run while the Real-Time controller re-boots.
Figure 3: FPGA Watchdog for CompactRIO Controller Implementation
System Monitoring
With LabVIEW Real-Time there are many different system attributes you can monitor from an Application. The following are a few important attributes that can be used to indicate when a system may be operating out of its normal conditions:
CPU usage
Chassis temperature
Ethernet connectivity
Transient Error Monitoring
Power Monitoring
Disk Access Monitoring
Any critical application values
4. Utilizing CompactRIOs FPGA
Using the LabVIEW FPGA module, developers can implement a wide variety of data acquisition and processing routines that run on FPGA targets such as Single-Board RIO and CompactRIO devices. Hardware execution provides greater performance and determinism than most processor-based software solutions. Once the code is compiled and running on the FPGA it will run without the jitter associated with software execution and thread prioritization typical to most common operating system and even present to a much smaller degree in real-time operating systems.
LabVIEW's graphical programming methodology is inherently parallel in nature and lends itself to designing highly parallel code. On a CPU based target such as Windows the graphical code is scheduled into serial program execution where all functions and operation are handled sequentially on the processor. The LabVIEW scheduler takes care of managing multiple loops, timing, priorities and other settings that determine when each function is executed. This sequential operation causes timing interaction between different parts of an application and creates jitter in program execution.
On an FPGA-based target, each application process (subset of the application that you define) is implemented within a loop structure. The LabVIEW diagram is mapped to the FPGA gates and slices so that parallel loops in the block diagram are implemented on different sections of the FPGA fabric. This allows all processes to run simultaneously (in parallel). The timing of each process is independent of the rest of the diagram, which eliminates jitter. This also means that you can add additional loops without affecting the performance of previously-implemented processes. You can add operations that enable interaction between loops for synchronization or exchanging data. See the Tutorial "Optimizing your LabVIEW FPGA VIs: Parallel Execution and Pipelining" and "Optimizing FPGA Code" for additional information.
Additionally, you can download a VI or bitfile to the flash memory on the FPGA target to control power up or emergency states. An application might require that the I/O on the FPGA target be set to a known value when the system powers on or goes into an emergency state.
To take advantage of this, program the FPGA VI so that the block diagram sets the output states without any dependencies on the host VI. For example, you can place the digital and analog output functions in the first frame of a sequence structure. You then place the rest of the LabVIEW code in the subsequent frames of the sequence structure, as shown in the following figure. Then configure the FPGA VI to start executing as soon as it is loaded in the FPGA. Compile and download the FPGA VI to the flash memory on the FPGA target and configure the FPGA target to automatically load the FPGA VI from the flash memory when the FPGA target powers on. When the FPGA target powers on, the FPGA VI loads into the FPGA from the flash memory, and the FPGA VI starts executing immediately. The output functions in the first frame of the sequence structure on the FPGA VI set the power-on output states.
Figure 4. Power On and Emergency States
You can also create more than a static power-on or emergency state for the outputs of the FPGA target. You can create arbitrary power-on functionality that performs complex actions. For example, you can set outputs based on the state of the inputs, use serial communication with an external device, and so on.
5. Redundancy
Redundancy is the approach of having two or more modules operating in parallel with equivalent functionality, so that if one module fails the other(s) will take over operations with the main goal of reducing downtime. Without redundancy system downtime can take hours or even days whereas a system with properly implemented redundancy can reduce this downtime to sub seconds.
Figure 5: Redundacy
Reliability and Availability can be greatly improved by leveraging redundancy techniques.
Hardware Redundancy
Generally the complexity of the redundant system is limited only by programming and the hardware costs. The difficulty come from deciding when to switch to the redundant system. Below are some common hardware redudancy techniques.
Cold Standby
The redundant modules(s) is not up and running to avoid common mode failures and to preserve the reliability of the standby module.
Figure 6: Cold Standby Redundancy
Hot Standby
The redundant module(s) is up and running to minimize switchover times thus improving system availability.
Figure 7: Hot Standby Redundancy
Some additional types of Redundancy are the following:
Standby, Fall-back, or Backup Redundancy
When the primary module fails then operations are switched over to a standby module.
Replication or Parallel Redundancy
Modules run in parallel and vote on the fly to decide which module will have control.
Diversity Redundancy
Similar to Replication Redundancy except the modules have completely different implementations to avoid common mode failures.
Dual Power Supply Inputs
Both CompactRIO and FieldPoint controllers are equipped with Dual Power Supply inputs. The controllers draw power from either V1 or V2 depending on which terminal has a higher voltage and can switch between inputs without affecting operation. The Power LED on CompactRIO controllers is a bi-color LED that will indicate which power supply input the system is powered from. When the controller is powered from V1, the POWER LED is lit green. When the controller is powered from V2, the POWER LED is lit yellow.
With FieldPoint, you can use the Power Source I/O Item on the controller to determine which power supply is being used. A 0 indicates that the primary power supply is in use; a 1 indicates that the secondary power supply is in use. With CompactRIO, you can read the Power Source I/O value from a VI.
For applications were its important to know if the primary supply has failed you can monitor which power supply you are using in a low priority thread. When the application observes its running off the secondary power supply the application safely shutdown itself. Simple implementation of a Capacitor acting as a Secondary supply to give additional seconds for an application to close safely is show below:
Figure 8: Dual Power Supply with Capacitor Circuit
A larger capacitor will allow for more time to safely shutdown the system.
Software Redundancy
System Replication Tools
The system replication tools can be used to quickly get a new system up and running if a current systems software fails for any reason. With these tools, you can format a Real-Time system, set it’s IP address, get an image off of another similar RT Target, and set that image on a new target. Additionally there are also FPGA Target Replication Tools for Real-Time systems with FPGA targets.
6. Conclusion
The CompactRIO and Compact FieldPoint products from National Instruments (NI) are designed, manufactured, and tested with the goal of delivering the highest quality products for these High Availability Applications.
