Explore Measurement Studio Features
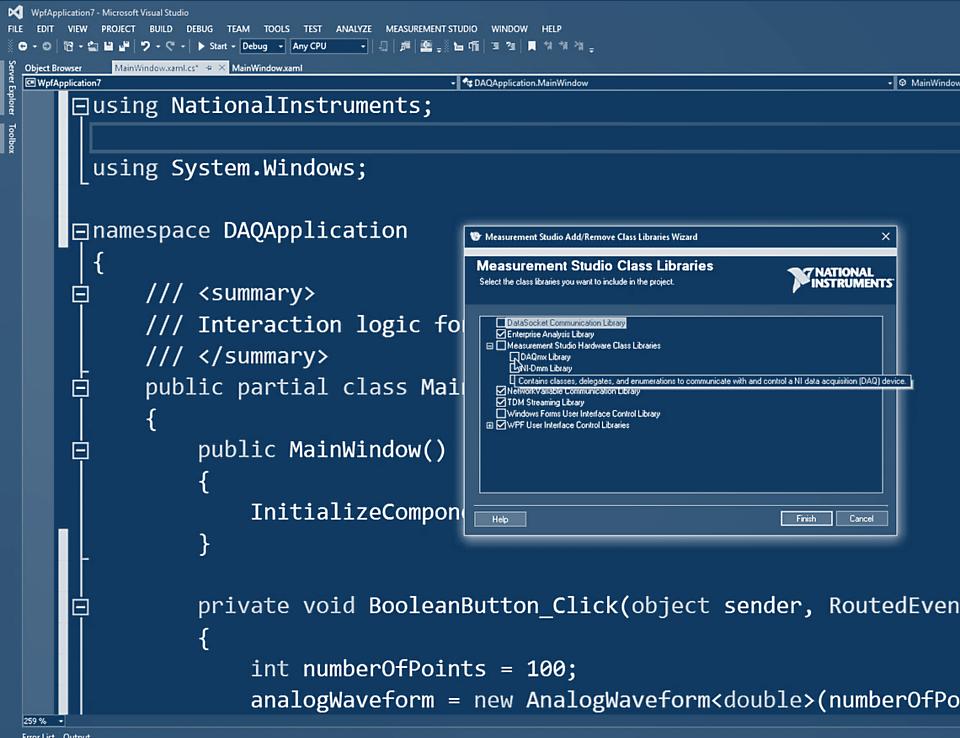
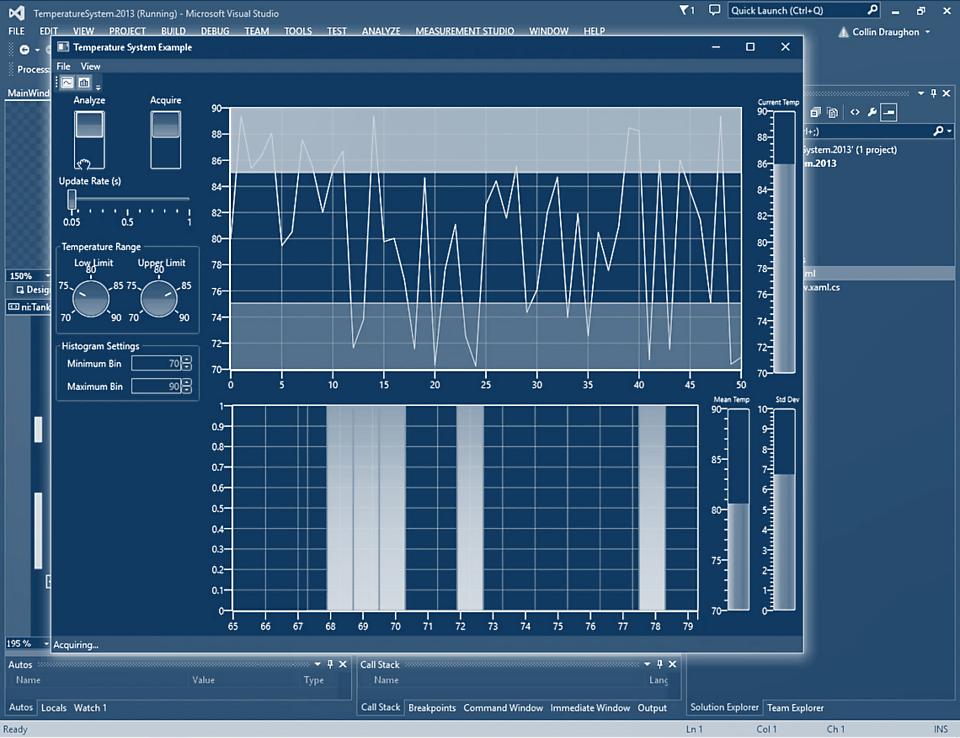
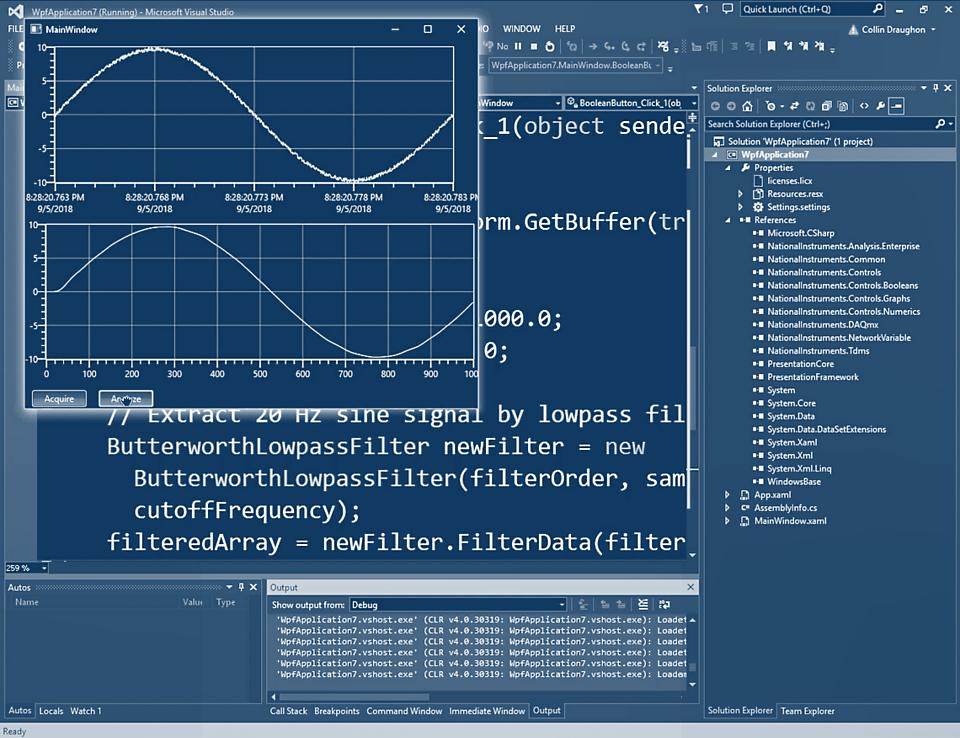
Measurement Studio is the only set of .NET tools designed for building engineering applications in Microsoft Visual Studio to acquire, analyze, and display measurement data. You can present data clearly with engineering UI controls that are compatible with hardware-acquired data types. Measurement Studio removes the complexity of hardware communication through high-level, intuitive, object-oriented hardware class libraries. You can add custom information to acquired data by using the fastest and most flexible format for storing measurement data to disk, TDMS. You can also perform inline analysis in real time on acquired signals without the difficult task of writing custom parsing algorithms.
Subscription Benefits
Included Services
Every purchase includes access to features that help you be successful with your software:
- Technical support from degreed engineers
- Automatic version updates
- 24/7 access to selected online training and virtual demonstrations
- Access to historical versions in case you need to share code with your team
Which Measurement Studio Edition Is Right for My Project?
Measurement Studio Standard Edition
- Support for Microsoft Visual Studio .NET 2019, 2017, and 2015
- Project setup wizard to speed up development
- Engineering controls for creating Windows Forms or Windows Presentation Foundation (WPF) applications
- Recommended for data acquisition and instrument control applications
Measurement Studio Professional Edition
- Installer Builder for building applications
- Professional Analysis Class Library for Array Operations, Signal Generation, Windowing, Filters, and Signal Processing
- Recommended for signal processing and sharing data via network variables
- Required for creating ASP.NET Web applications
Measurement Studio Enterprise Edition
- Enterprise Analysis class library for spectral measurements, linear algebra, statistics, and curve fitting
- Recommended for advanced data analysis applications
HOW TO BUY MEASUREMENT STUDIO
Buy Measurement Studio for You
A single-seat license of Measurement Studio can be associated with an individual or to a specific computer ID.
Buy Measurement Studio for Your Team
The Volume License Program is designed for teams that need five or more licenses. It reduces the total cost of ownership by providing streamlined asset management to your organization.
Not Sure Which License Type Is Right for You?
Contact us to learn more.
Related Products
TestStand
TestStand is application software that helps test and validation engineers quickly build and deploy automated test systems.
Automated Test Software Suite
The Automated Test Software Suite is a collection of software for characterizing, validating, and testing electronic devices.
Multi-IDE Bundle
The Multi-IDE Bundle is a collection of integrated development environments (IDEs) you can use to build applications in the programming language of your choice.