From Friday, April 19th (11:00 PM CDT) through Saturday, April 20th (2:00 PM CDT), 2024, ni.com will undergo system upgrades that may result in temporary service interruption.
We appreciate your patience as we improve our online experience.
From Friday, April 19th (11:00 PM CDT) through Saturday, April 20th (2:00 PM CDT), 2024, ni.com will undergo system upgrades that may result in temporary service interruption.
We appreciate your patience as we improve our online experience.
Use the DIAdem VIEW panel to inspect data, the ANALYZE panel to perform advanced calculations on data using hundreds of built-in engineering-focused analysis functions, and the REPORT panel to create professional reports using a what-you-see-is-what-you-get report editor.
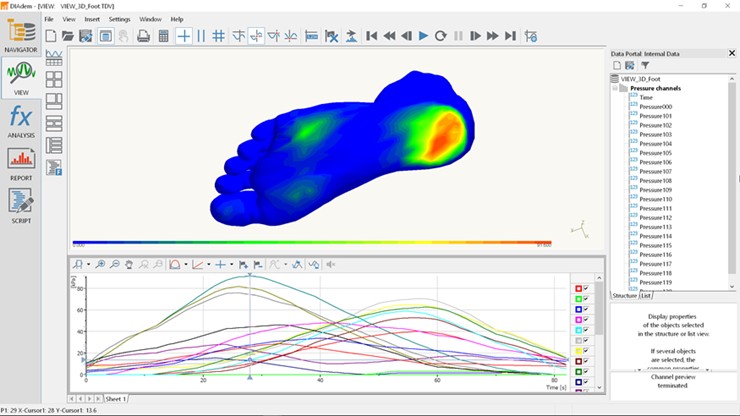
Interactively inspecting test data is critical to understanding what takes place during a test. Often you know just by looking at the data if the test is a success or failure. In addition, the ability to overlay several test runs and visually correlate the results gives you the insight necessary to make key decisions. In DIAdem VIEW, you visually inspect your data and draw conclusions by interacting with it in tabular and graphical forms. You use scroll and zoom cursors to identify peaks and features in your data and different cursor options to graphically delete, fit, or copy ranges of data.

Interactively Visualize Your Data
Figure 1: DIAdem VIEW
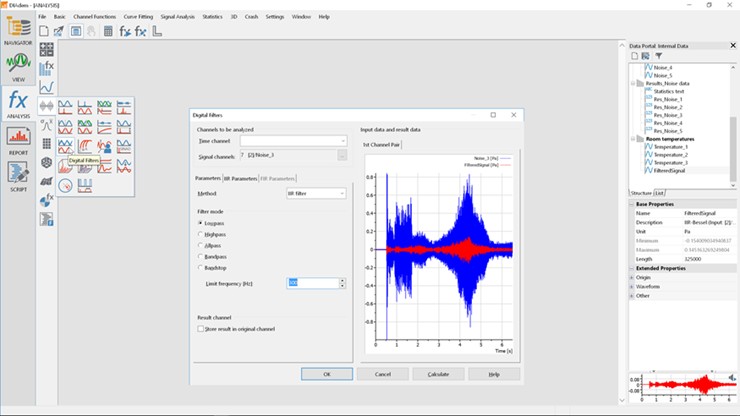
DIAdem ANALYSIS offers a wide range of mathematical routines for analyzing your data. DIAdem separates analysis libraries into groups of similar functionality, and each analysis function has its own unique set of parameters. The DIAdem ANALYSIS functions are completely mouse-driven and require no additional scripting to analyze your data. With the formula interpreter, you can enter your own math functions interactively.
diadem_analysis
Figure 2: DIAdem ANALYSIS
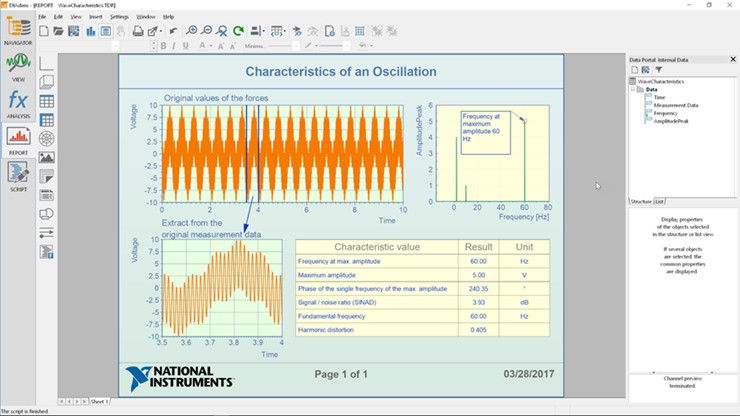
To share results with others and collaborate on projects, you must communicate results clearly and concisely. With a drag-and-drop environment tailored for creating engineering and scientific reports, DIAdem REPORT makes it easy to present and share your results with coworkers. With DIAdem, you can create professional, publication-ready reports using a what-you-see-is-what-you-get (WYSIWYG) report editor and export them to the most common report formats. Design publication-quality reports, share your results with coworkers, and document your ideas using DIAdem REPORT. After creating a DIAdem REPORT template, save it to share with coworkers or to use with other data sets.
Automate Common Analysis and Reporting
Figure 3: DIAdem REPORT